Set up
suppressPackageStartupMessages({
  library(dplyr)
  library(ggplot2)
  library(purrr)
  library(stringr)
  library(SummarizedExperiment)
  library(SingleCellExperiment)
  library(scater)
  library(scran)
  library(igraph)
  library(SingleR)
  library(scuttle)
  library(celldex)
  library(ggbeeswarm)
  library(tidySingleCellExperiment)
  library(bluster)
  library(BiocParallel)
})
n_workers <- 20
RhpcBLASctl::blas_set_num_threads(n_workers)
bpparam <- BiocParallel::MulticoreParam(workers=n_workers, RNGseed = 123)

here::here()
[1] "/home/retger/Synovial/synovialscrnaseq"remove_low_quality_samples <- TRUE
analysis_version <- 7
set.seed(100)
load data from preprocessing
tmpfilename <- paste0("syn_v",analysis_version,"_sce_filtered",dplyr::if_else(remove_low_quality_samples, "_invivo",""),".rds")
syn_sce_tidy_filtered <- readRDS(file = here::here("output",tmpfilename))
SCtransform
transform
set.seed(123)
vst_out <-   sctransform::vst(counts(syn_sce_tidy_filtered), method = "glmGamPoi_offset", n_genes=NULL,
                              exclude_poisson = TRUE,  return_cell_attr = TRUE,
                              return_corrected_umi = TRUE,verbosity=1)
Calculating cell attributes from input UMI matrix: log_umiTotal Step 1 genes: 17057Total overdispersed genes: 16744Excluding 313 genes from Step 1 because they are not overdispersed.Variance stabilizing transformation of count matrix of size 17057 by 102758Model formula is y ~ log_umiGet Negative Binomial regression parameters per geneUsing 16744 genes, 102758 cellsSetting estimate of 2 genes to inf as theta_mm/theta_mle < 1e-3# of step1 poisson genes (variance < mean): 0# of low mean genes (mean < 0.001): 840Total # of Step1 poisson genes (theta=Inf; variance < mean): 602Total # of poisson genes (theta=Inf; variance < mean): 910Calling offset model for all 910 poisson genesFound 631 outliers - those will be ignored in fitting/regularization stepIgnoring theta inf genesReplacing fit params for 910 poisson genes by theta=InfSecond step: Get residuals using fitted parameters for 17057 genesComputing corrected count matrix for 17057 genesCalculating gene attributesWall clock passed: Time difference of 1.071576 hours# discard genes that could not be transformed
genes_not_in_vst <- which(!(rownames(syn_sce_tidy_filtered) %in% rownames(vst_out$y)))
if(length(genes_not_in_vst) != 0){
warning(paste(length(genes_not_in_vst), "genes removed!"))
syn_sce_tidy_filtered <- syn_sce_tidy_filtered[-genes_not_in_vst, ]
}
assay(syn_sce_tidy_filtered, "vstresiduals") <- vst_out$y
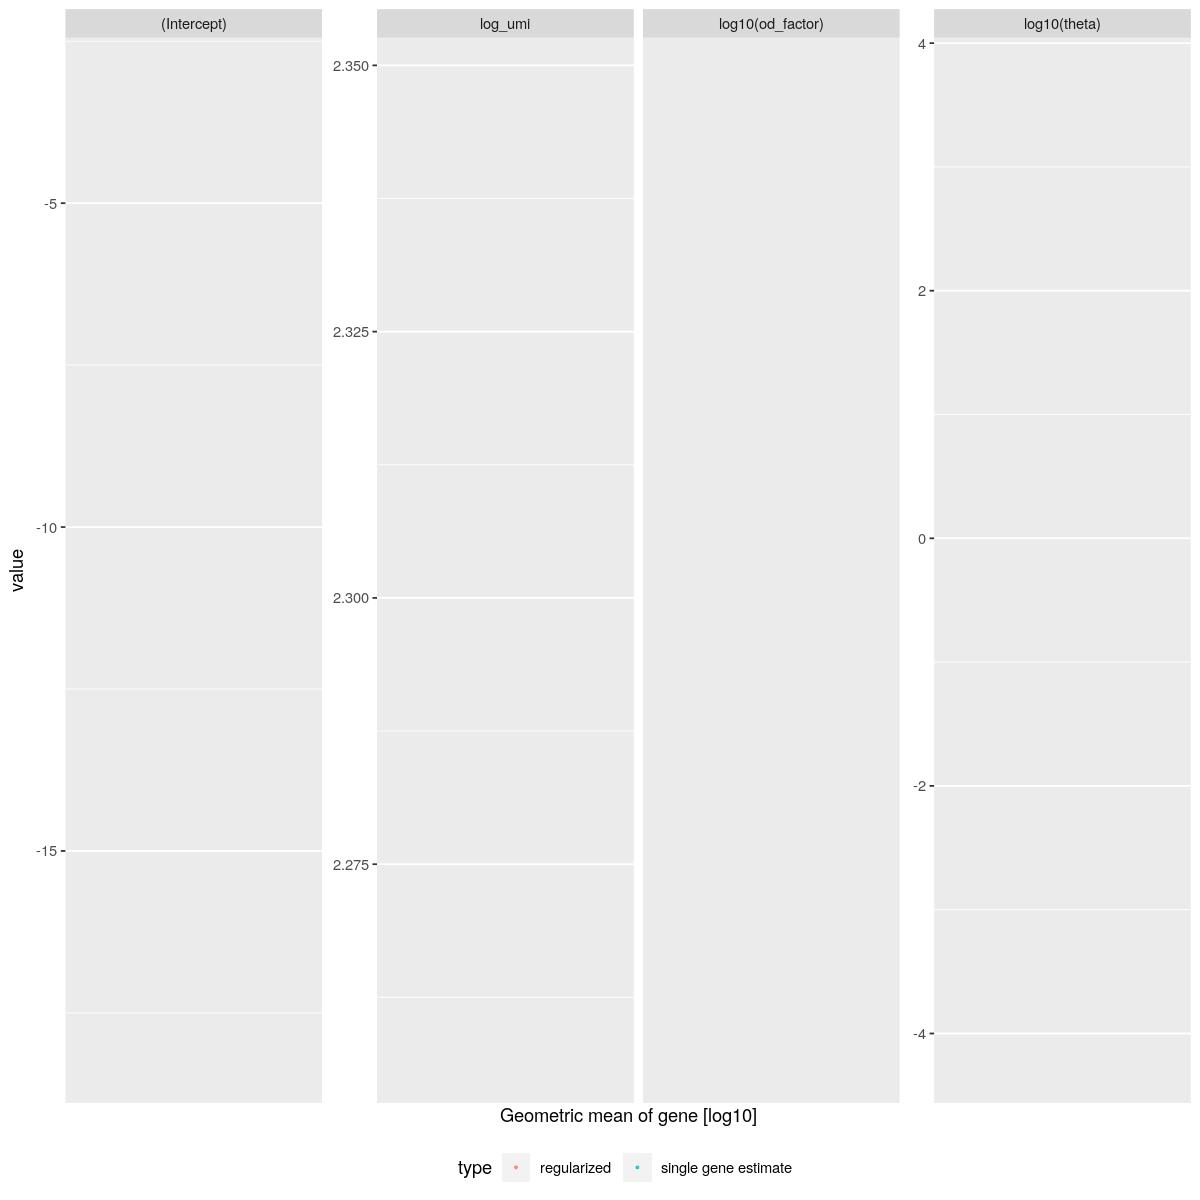
sctransform::plot_model_pars(vst_out, show_theta = TRUE)Warning: Removed 66976 rows containing missing values (geom_point).Warning: Removed 68228 rows containing missing values (geom_point).
Past versions of vst-1.jpeg
Version
Author
Date
9133ed1
Reto Gerber
2022-03-04
222b0d1
Reto Gerber
2021-07-29
# hist(assay(syn_sce_tidy_filtered, "logcounts"),breaks=300, main="All")
par(mfrow=c(1,2))
cat("### Data characteristics {.tabset}\n\n")
Data characteristics
cat("#### RowMax\n\n")
RowMax
cmaxes <- rowMaxs(assay(syn_sce_tidy_filtered, "vstresiduals"))
hist(cmaxes,breaks=100, main="RowMax - vst", xlab="RowMax vstresiduals")
cmaxes <- rowMaxs(assay(syn_sce_tidy_filtered, "logcounts"))
hist(cmaxes,breaks=100, main="RowMax - logcounts", xlab="RowMax logcounts")
Past versions of “explore transformed data plots-1.jpeg”
cat("\n\n#### RowMean \n\n")
RowMean
cmean <- rowMeans(assay(syn_sce_tidy_filtered, "vstresiduals"))
hist(cmean,breaks=100, main="RowMean -vst", xlab="RowMean vstresiduals")
cmean <- rowMeans(assay(syn_sce_tidy_filtered, "logcounts"))
hist(cmean,breaks=100, main="RowMean - logcounts", xlab="RowMean logcounts")
Past versions of “explore transformed data plots-2.jpeg”
cat("\n\n#### RowVar \n\n")
RowVar
cvar <- rowVars(assay(syn_sce_tidy_filtered, "vstresiduals"))
hist(cvar,breaks=100, main="RowVar - vst", xlab="RowVar vstresiduals")
cvar <- rowVars(assay(syn_sce_tidy_filtered, "logcounts"))
hist(cvar,breaks=100, main="RowVar - logcounts", xlab="RowVar logcounts")
Past versions of “explore transformed data plots-3.jpeg”
cat("\n\n#### RowMin \n\n")
RowMin
cvar <- rowMins(assay(syn_sce_tidy_filtered, "vstresiduals"))
hist(cvar,breaks=100, main="RowMin - vst", xlab="RowMin vstresiduals")
cvar <- rowMins(assay(syn_sce_tidy_filtered, "logcounts"))
hist(cvar,breaks=100, main="RowMin - logcounts", xlab="RowMin logcounts")
Past versions of “explore transformed data plots-4.jpeg”
cat("\n\n#### COL1A2 \n\n")
COL1A2
hist(assay(syn_sce_tidy_filtered, "vstresiduals")[which(rowData(syn_sce_tidy_filtered)$Symbol == "COL1A2"), ], xlab="vstresiduals", main="COL1A2 - vst", breaks=100)
hist(assay(syn_sce_tidy_filtered, "logcounts")[which(rowData(syn_sce_tidy_filtered)$Symbol == "COL1A2"), ], xlab="logcounts", main="COL1A2 - logcounts", breaks=100)
Past versions of “explore transformed data plots-5.jpeg”
cat("\n\n### {-}")
HVG subsetting
# only keep highly variable genes
res_var <- sctransform::get_residual_var(vst_out, vst_out$umi_corrected,verbosity=1)
Calculating variance for residuals of type pearson for 17057 geneshvg_vst <- names(res_var)[order(res_var,decreasing = TRUE)[1:3000]]
rowData(syn_sce_tidy_filtered)$is_hvg_vst <- rownames(syn_sce_tidy_filtered) %in% hvg_vst# syn_sce_tidy_hvg <- syn_sce_tidy_filtered
# tmpfilename <- paste0("syn_v",analysis_version,"_sce_hvg",dplyr::if_else(remove_low_quality_samples, "_invivo",""),".rds")
# saveRDS(syn_sce_tidy_hvg, file = here::here("output",tmpfilename))
tmpfilename <- paste0("syn_v",analysis_version,"_vst_out",dplyr::if_else(remove_low_quality_samples, "_invivo",""),".rds")
saveRDS(vst_out, file = here::here("output",tmpfilename))tmpfilename <- paste0("syn_v",analysis_version,"_sce_hvg",dplyr::if_else(remove_low_quality_samples, "_invivo",""),".rds")
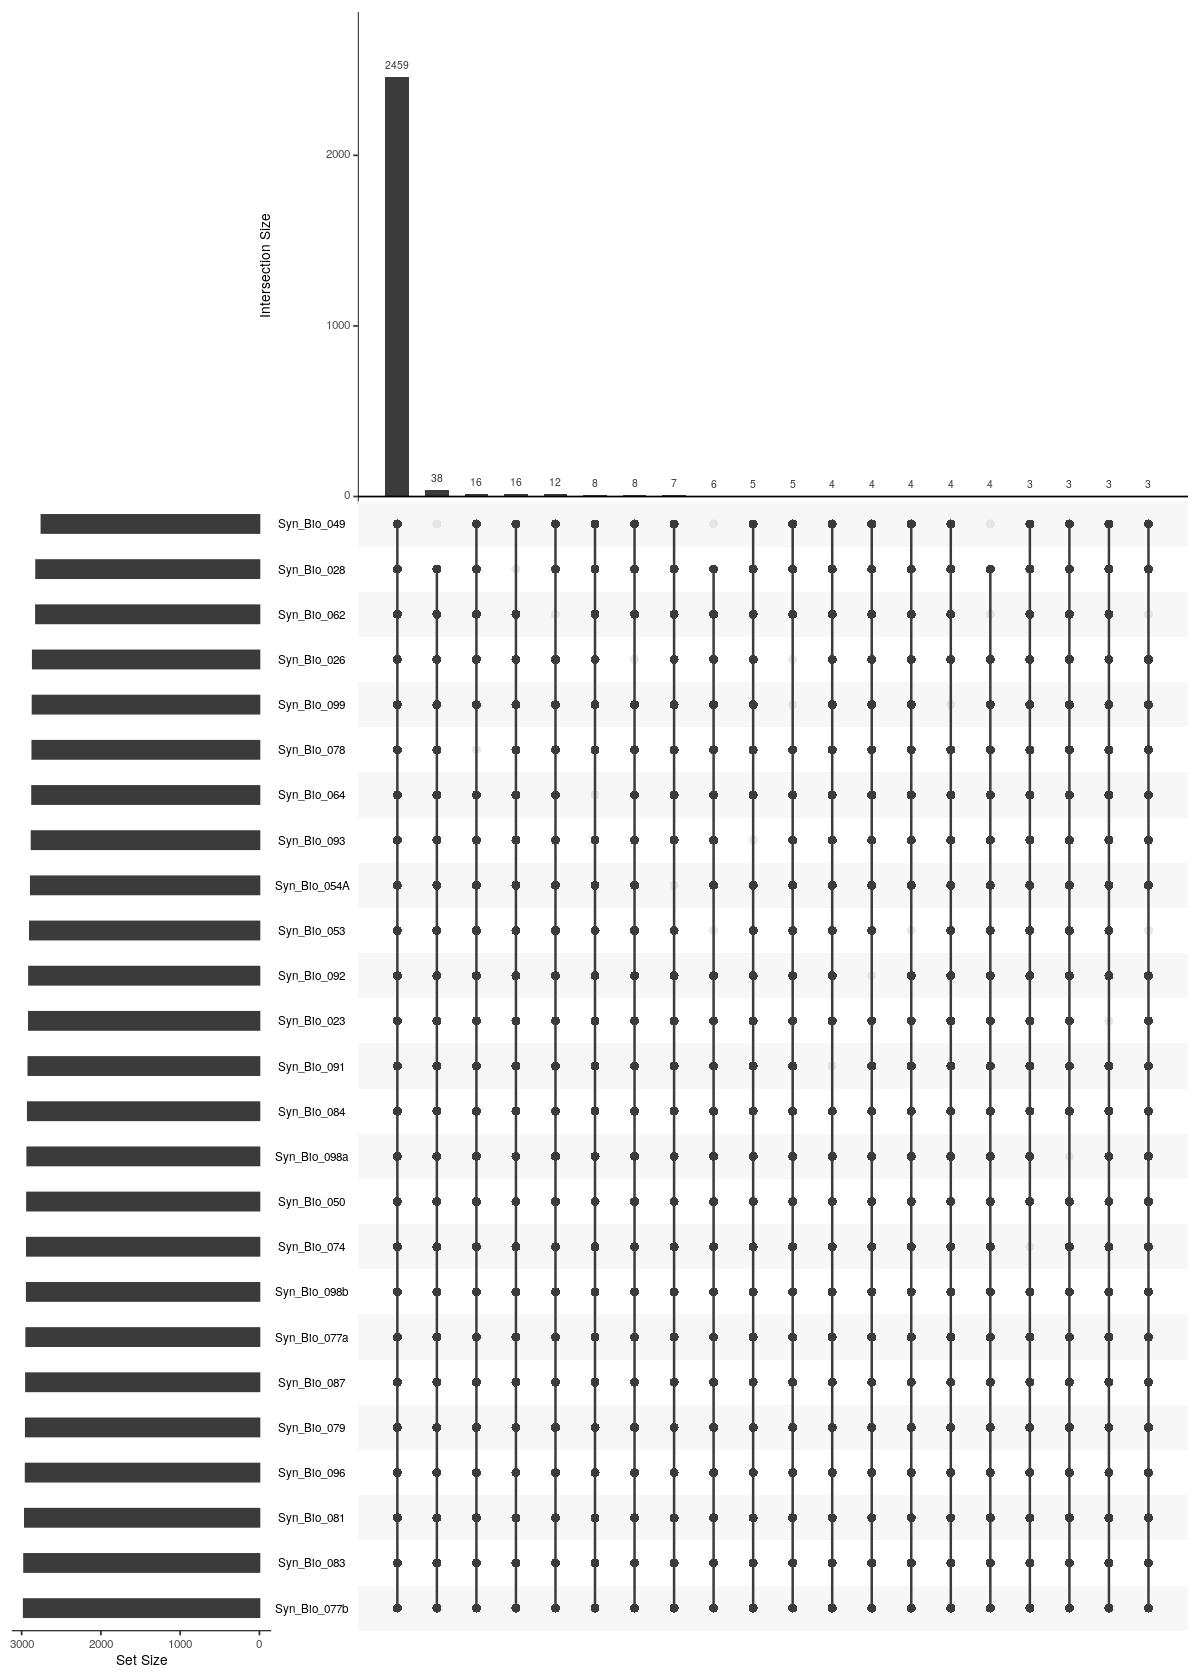
syn_sce_tidy_filtered <- readRDS(file = here::here("output",tmpfilename))cat("### Upsetplot detected HVG {.tabset}\n\n")
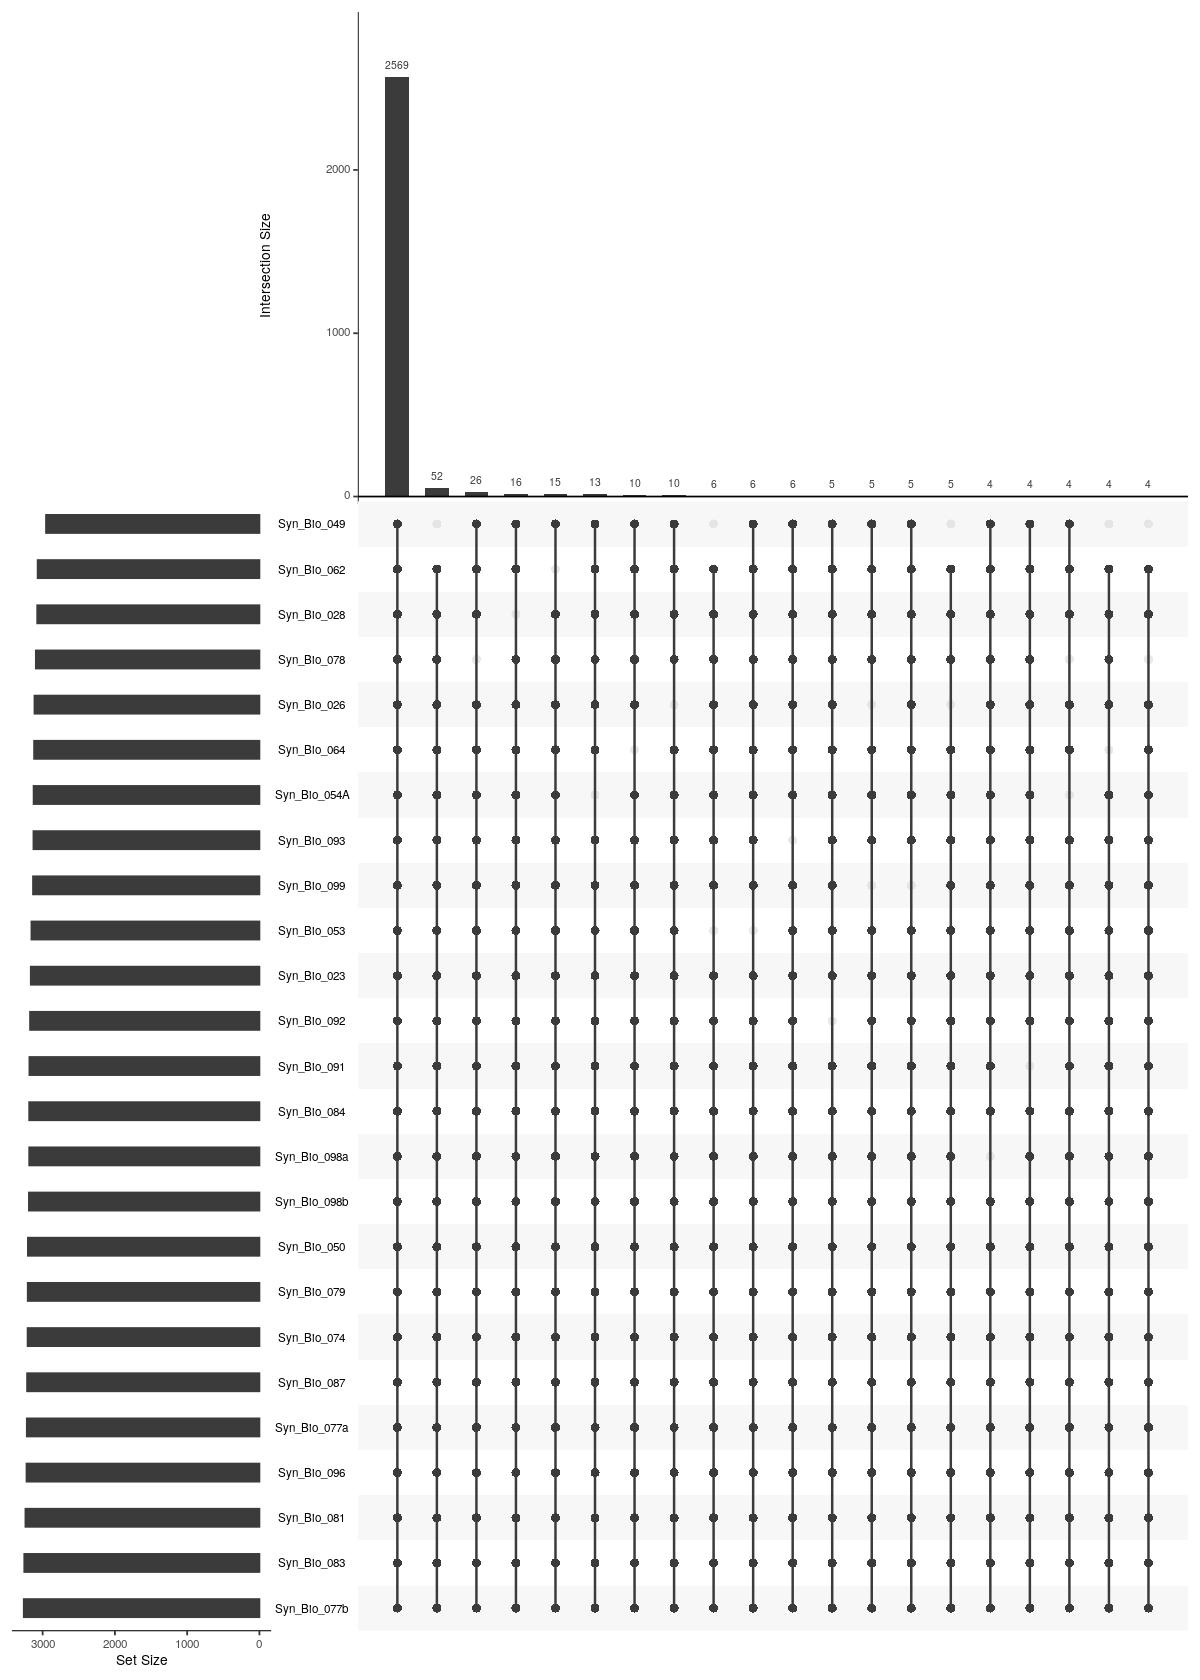
Upsetplot detected HVG
cat("#### Unique Sample \n\n")
Unique Sample
  suppressMessages(suppressWarnings(capture.output({tmpsce_nest_sample_unique <- syn_sce_tidy_filtered[rowData(syn_sce_tidy_filtered)$is_hvg_vst,] %>%
      nest(data=-Sample)
  })))
character(0)
upsetdat_sample_unique <- purrr::map(seq_along(tmpsce_nest_sample_unique$data), ~{
    ind <- rowSums(counts(tmpsce_nest_sample_unique$data[[.x]]) >0 ) >0
    rownames(rowData(tmpsce_nest_sample_unique$data[[.x]]))[ind]
  })
names(upsetdat_sample_unique) <- tmpsce_nest_sample_unique$Sample
UpSetR::upset(UpSetR::fromList(upsetdat_sample_unique),nsets = length(upsetdat_sample_unique), nintersects = 20, order.by = "freq", mb.ratio = c(0.3,0.7))
Past versions of upsetplot_vst-1.jpeg
Version
Author
Date
7d99571
Reto Gerber
2022-03-21
9133ed1
Reto Gerber
2022-03-04
222b0d1
Reto Gerber
2021-07-29
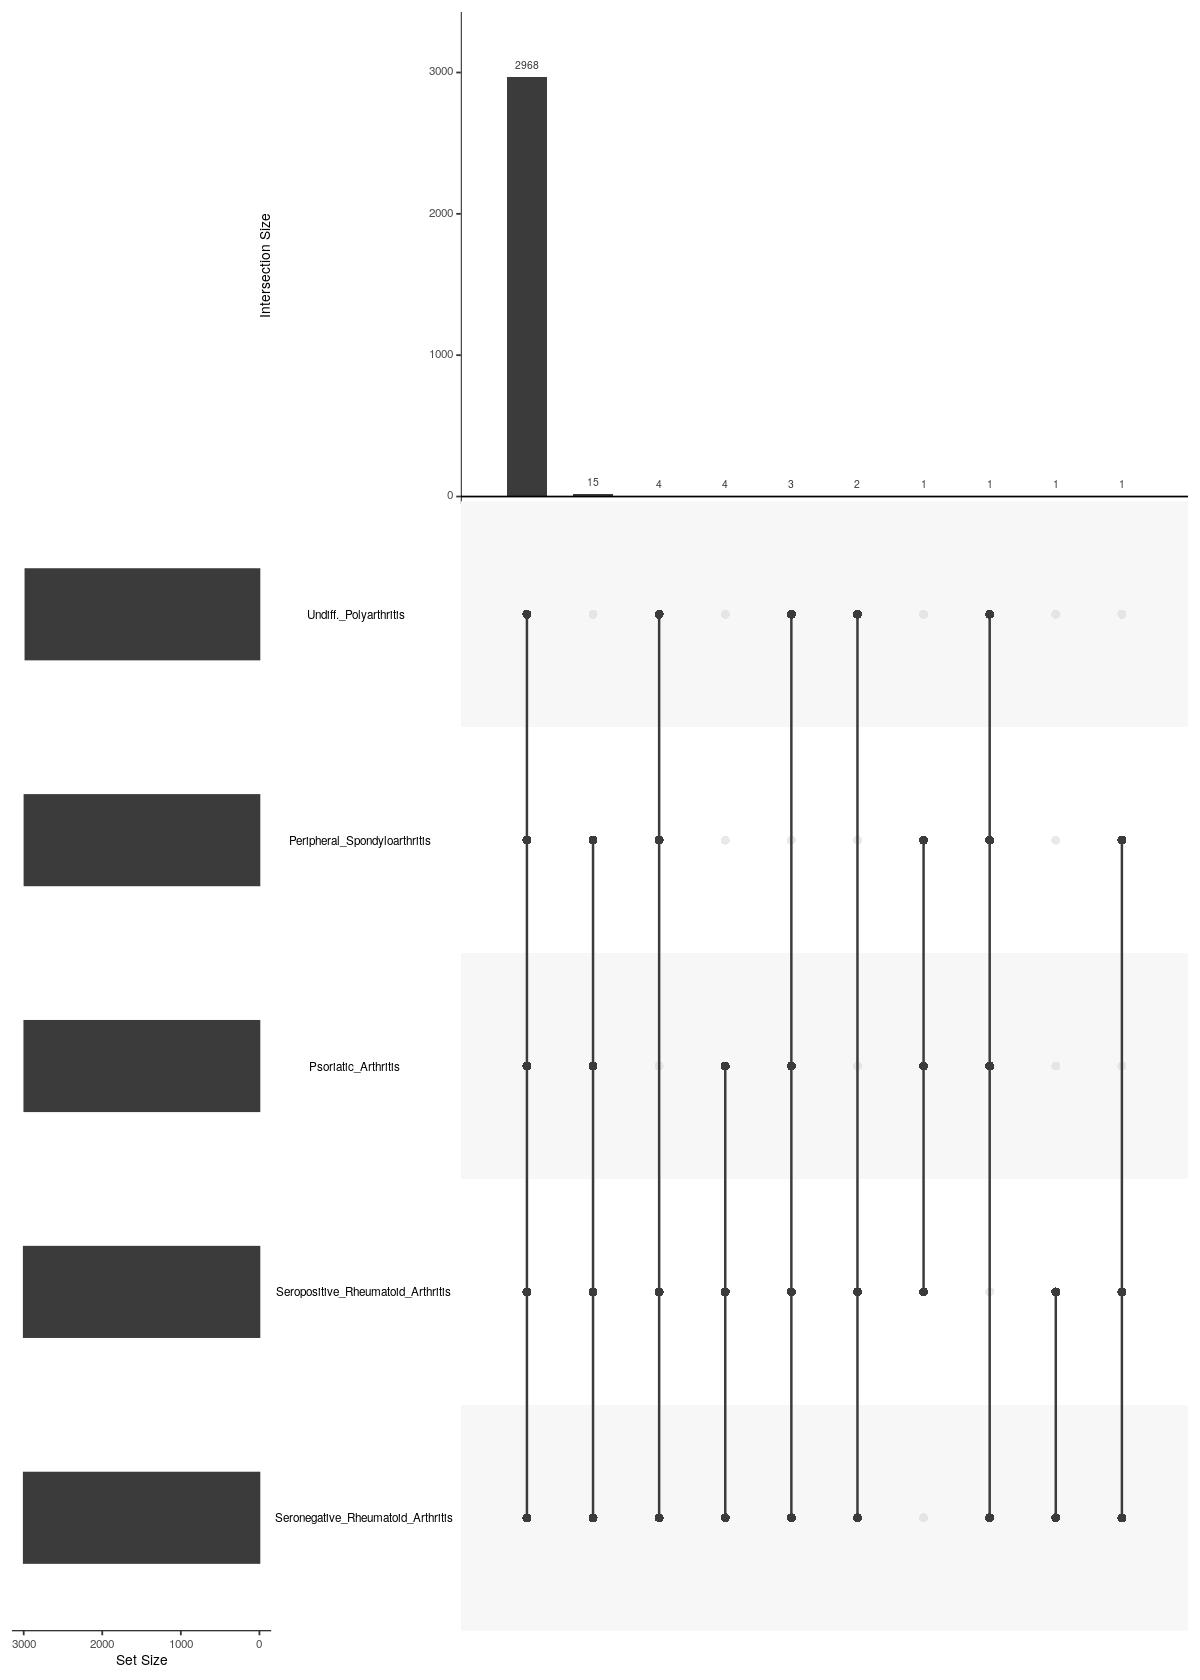
cat("\n\n")cat("#### main Diagnosis \n\n")
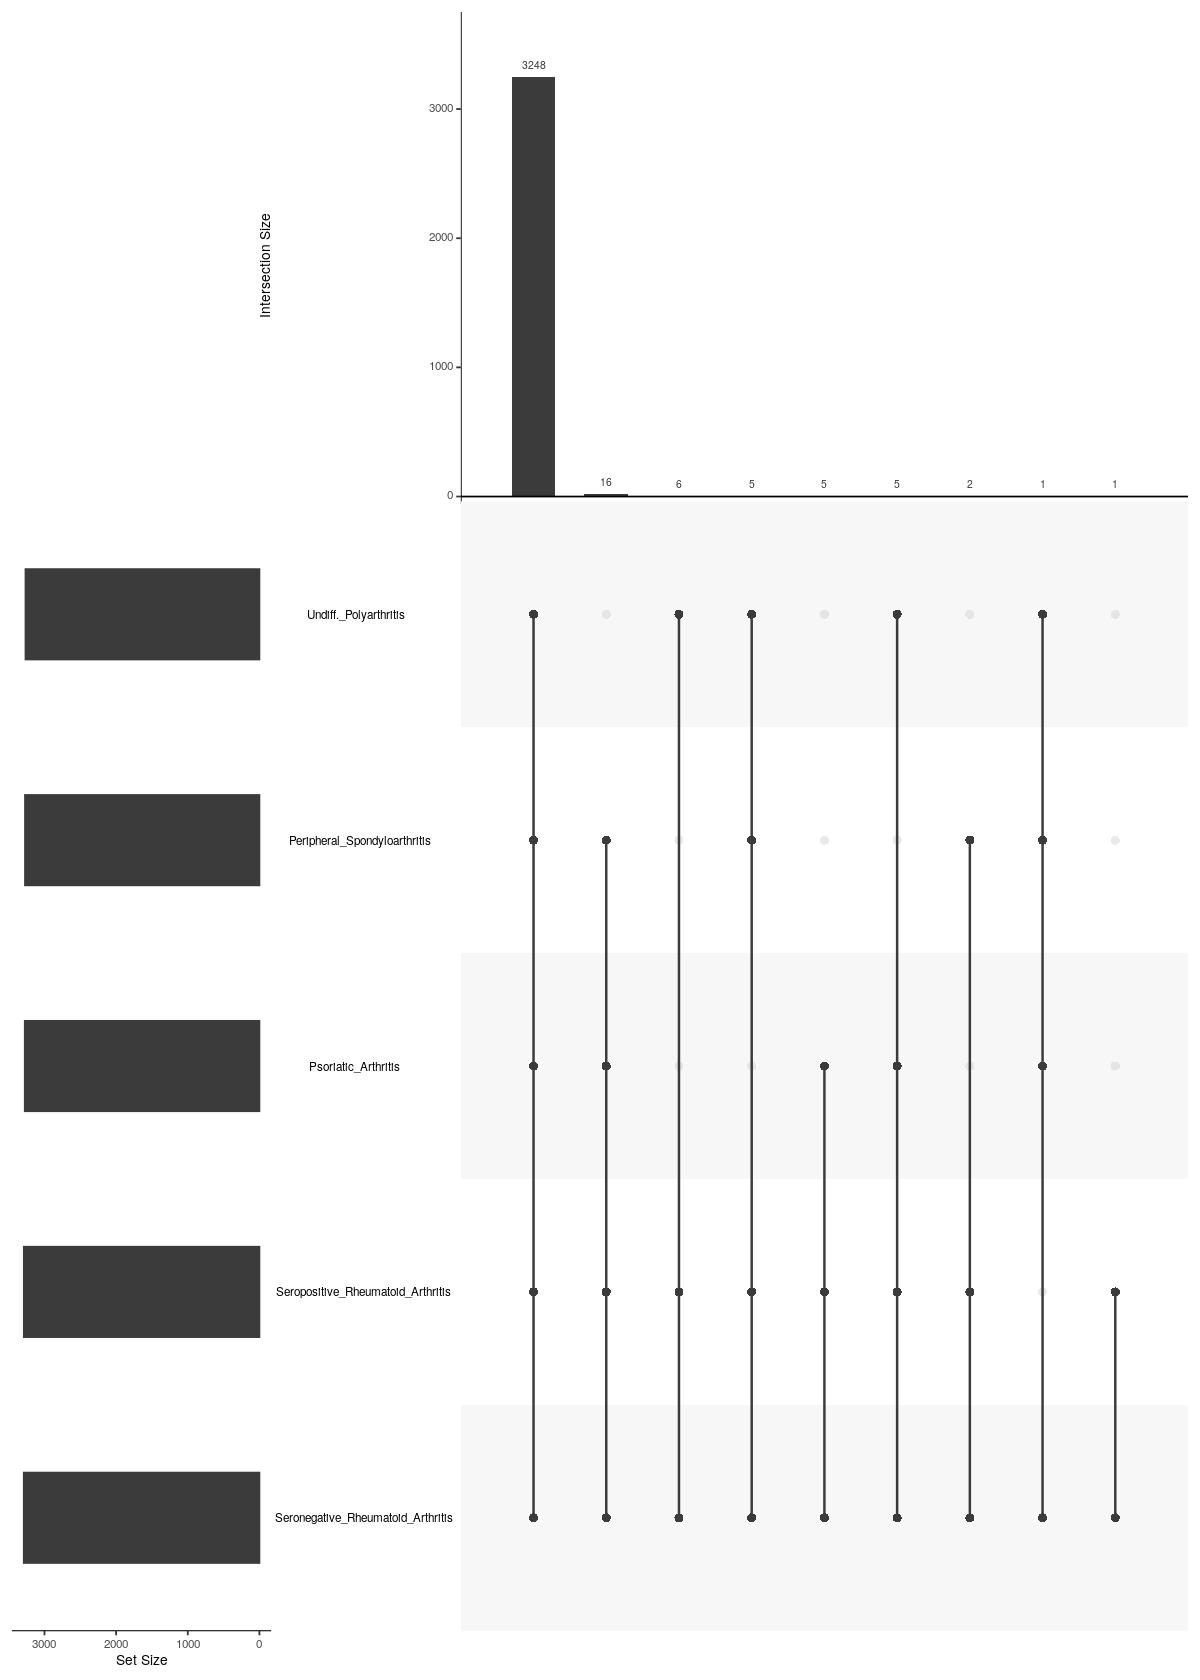
main Diagnosis
  suppressMessages(suppressWarnings(capture.output({tmpsce_nest_Diagnosis <- syn_sce_tidy_filtered[rowData(syn_sce_tidy_filtered)$is_hvg_vst,] %>%
    nest(data=-Diagnosis)
  })))
character(0)
upsetdat_Diagnosis <- purrr::map(seq_along(tmpsce_nest_Diagnosis$data), ~{
    ind <- rowSums(counts(tmpsce_nest_Diagnosis$data[[.x]]) >0 ) >0
    rownames(rowData(tmpsce_nest_Diagnosis$data[[.x]]))[ind]
  })
names(upsetdat_Diagnosis) <- tmpsce_nest_Diagnosis$Diagnosis
UpSetR::upset(UpSetR::fromList(upsetdat_Diagnosis),nsets = length(upsetdat_Diagnosis), nintersects = 20, order.by = "freq", mb.ratio = c(0.3,0.7))
Past versions of upsetplot_vst-2.jpeg
Version
Author
Date
9133ed1
Reto Gerber
2022-03-04
222b0d1
Reto Gerber
2021-07-29
cat("\n\n")cat("### {-}")
Dimensionality reduction
sce_tmp <- syn_sce_tidy_filtered[rowData(syn_sce_tidy_filtered)$is_hvg_vst,] %>%
  runPCA(name = "PCA",exprs_values = "vstresiduals")
ndims <- intrinsicDimension::maxLikGlobalDimEst(as.matrix(reducedDim(sce_tmp, "PCA")), k=20)
reducedDim(sce_tmp,"PCA_reduced") <- reducedDim(sce_tmp,"PCA")[,seq_len(ceiling(ndims$dim.est))]
reducedDimNames(sce_tmp)
[1] "PCA" "PCA_reduced"ncol(reducedDim(sce_tmp,"PCA_reduced"))[1] 8set.seed(100)
sce_tmp <- sce_tmp %>%
runUMAP(name = "UMAP", dimred = "PCA")
set.seed(100)
sce_tmp <- sce_tmp %>%
runUMAP(name = "UMAP_reduced", dimred = "PCA_reduced")
reducedDim(syn_sce_tidy_filtered,"PCA_vst") <- reducedDim(sce_tmp,"PCA")
reducedDim(syn_sce_tidy_filtered,"PCA_vst_reduced") <- reducedDim(sce_tmp,"PCA_reduced")
reducedDim(syn_sce_tidy_filtered,"UMAP_vst") <- reducedDim(sce_tmp,"UMAP")
reducedDim(syn_sce_tidy_filtered,"UMAP_vst_reduced") <- reducedDim(sce_tmp,"UMAP_reduced")n_sam <- length(unique(syn_sce_tidy_filtered$Sample))
splitind <- split(seq_len(n_sam),ceiling(seq(0.01,2.99,length.out = n_sam)))
colind <- unlist(purrr::map(seq_len(ceiling(n_sam/3)), ~ c(splitind[[1]][.x],splitind[[2]][.x],splitind[[3]][.x])))
colind <- colind[!is.na(colind)]
colors_used <- viridis::viridis(n_sam)[colind]
cat("### Dimred plots {.tabset}\n\n")
Dimred plots
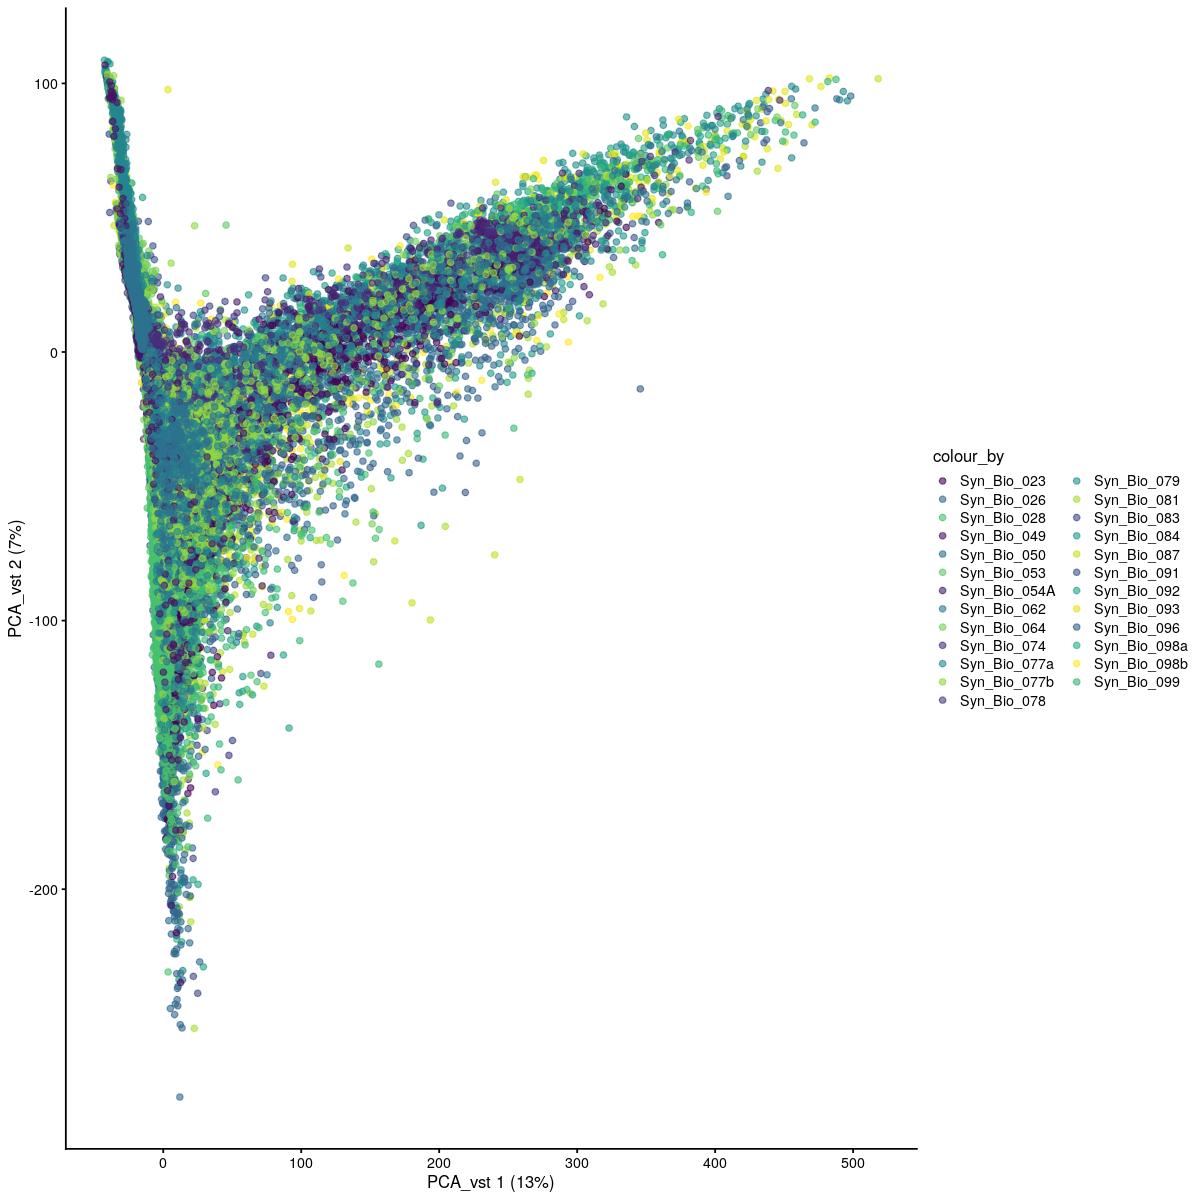
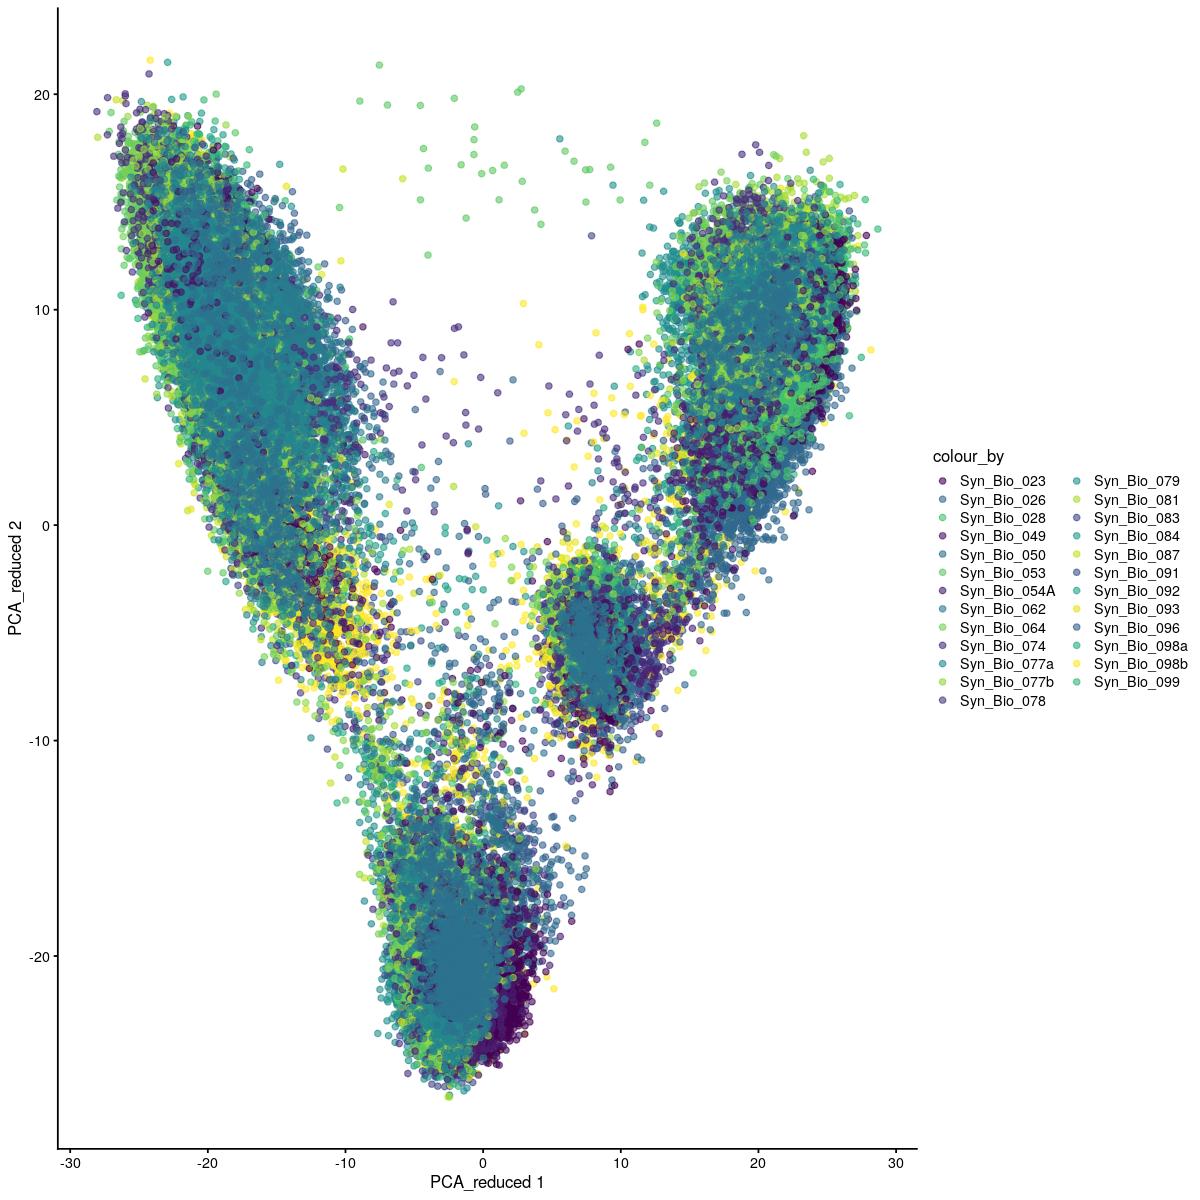
cat("#### PCA vst\n\n")
PCA vst
plotReducedDim(syn_sce_tidy_filtered, "PCA_vst", colour_by = "Sample") +
  scale_color_manual(values=colors_used)
Scale for 'colour' is already present. Adding another scale for 'colour',
which will replace the existing scale.
Past versions of PCA_color_by_sample_vst-1.jpeg
Version
Author
Date
7d99571
Reto Gerber
2022-03-21
9133ed1
Reto Gerber
2022-03-04
222b0d1
Reto Gerber
2021-07-29
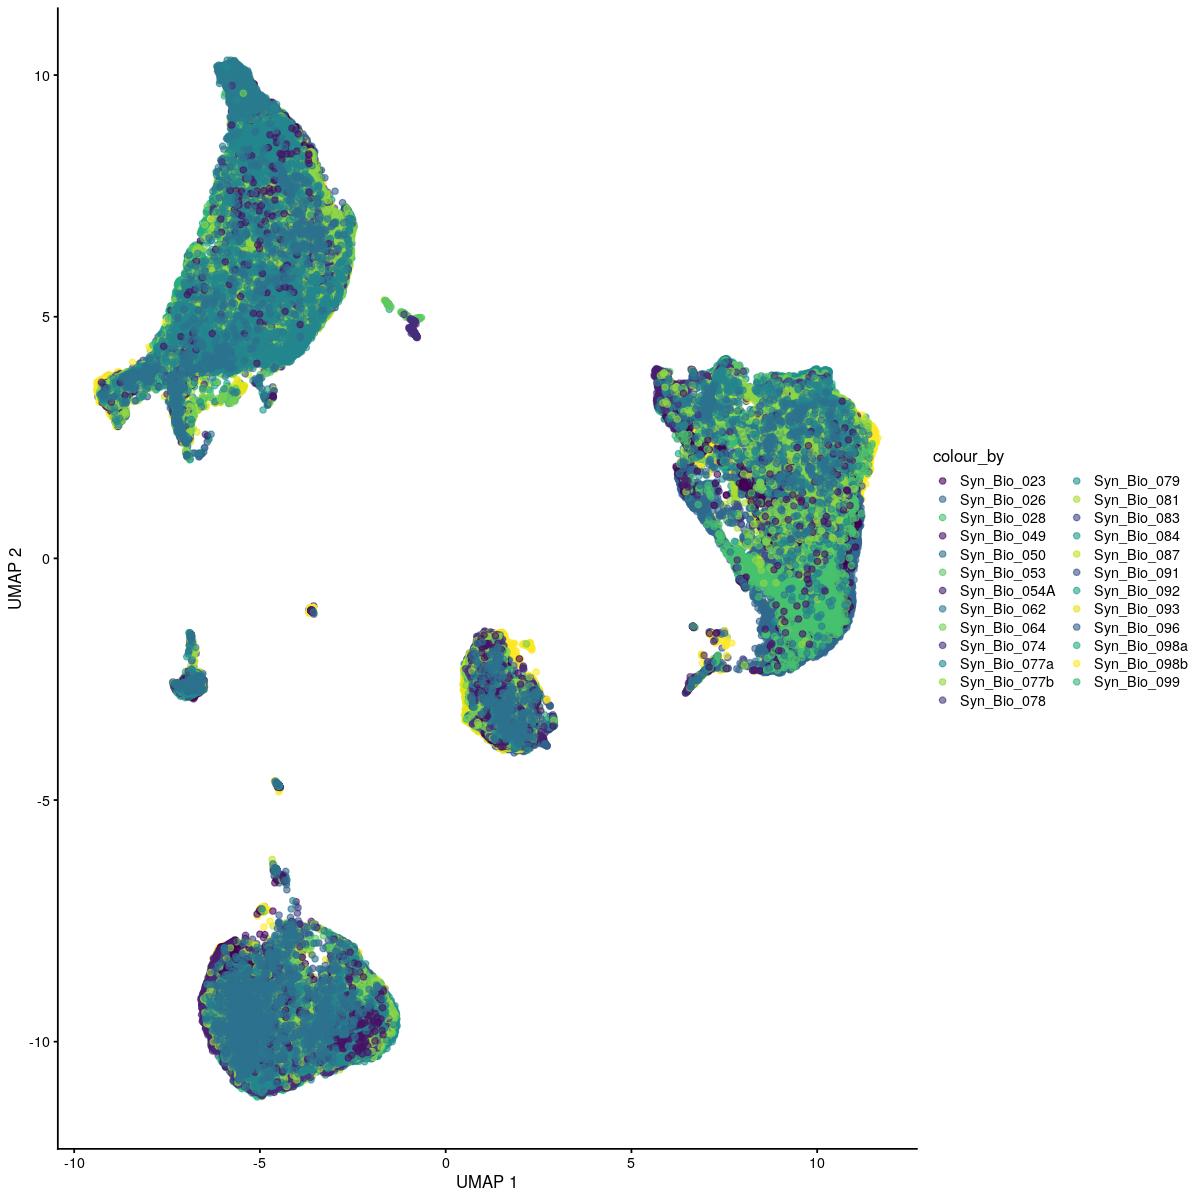
cat("#### UMAP vst\n\n")
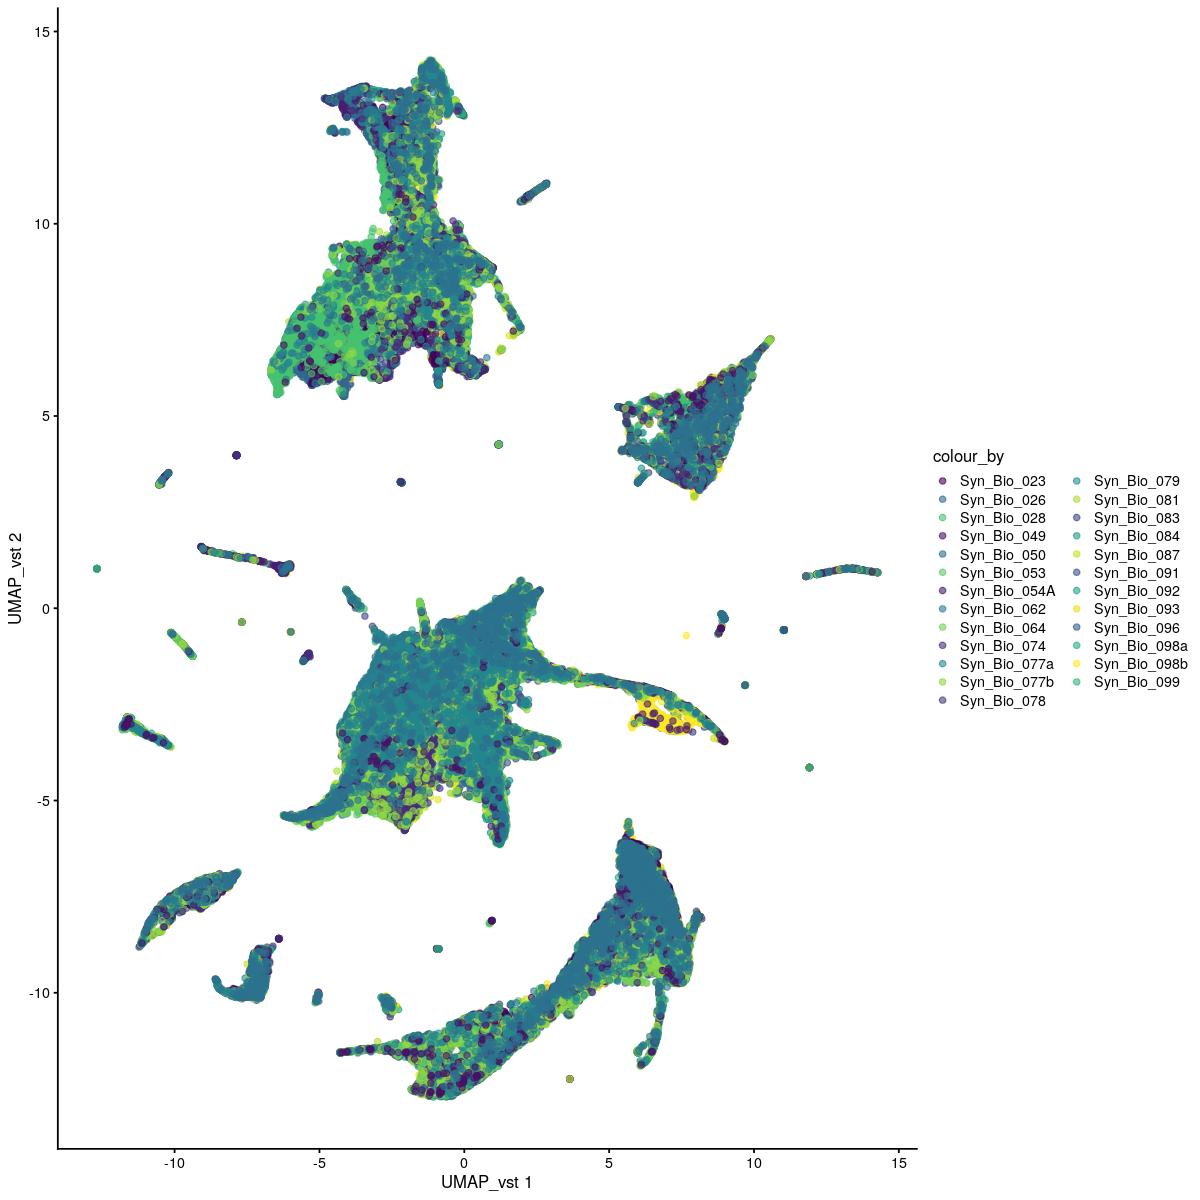
UMAP vst
plotReducedDim(syn_sce_tidy_filtered, "UMAP_vst", colour_by = "Sample") +
  scale_color_manual(values=colors_used)
Scale for 'colour' is already present. Adding another scale for 'colour',
which will replace the existing scale.
Past versions of PCA_color_by_sample_vst-2.jpeg
Version
Author
Date
7d99571
Reto Gerber
2022-03-21
9133ed1
Reto Gerber
2022-03-04
222b0d1
Reto Gerber
2021-07-29
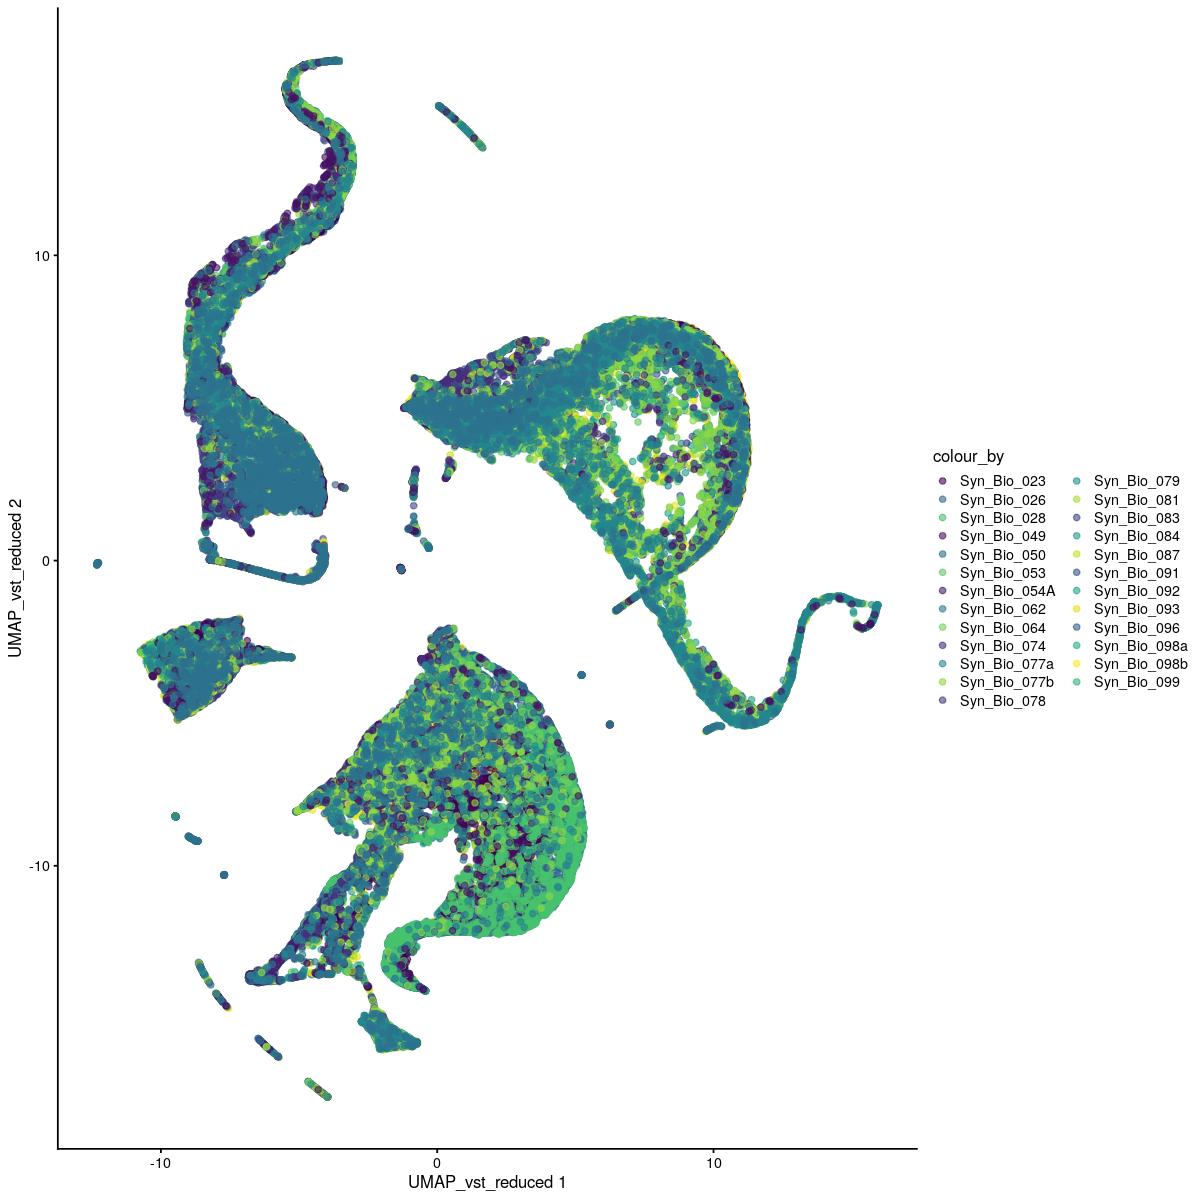
cat("#### UMAP vst reduced\n\n")
UMAP vst reduced
plotReducedDim(syn_sce_tidy_filtered, "UMAP_vst_reduced", colour_by = "Sample") +
  scale_color_manual(values=colors_used)
Scale for 'colour' is already present. Adding another scale for 'colour',
which will replace the existing scale.
Past versions of PCA_color_by_sample_vst-3.jpeg
Version
Author
Date
7d99571
Reto Gerber
2022-03-21
9133ed1
Reto Gerber
2022-03-04
222b0d1
Reto Gerber
2021-07-29
cat("\n\n### {-}")
Scran
HVG subsetting
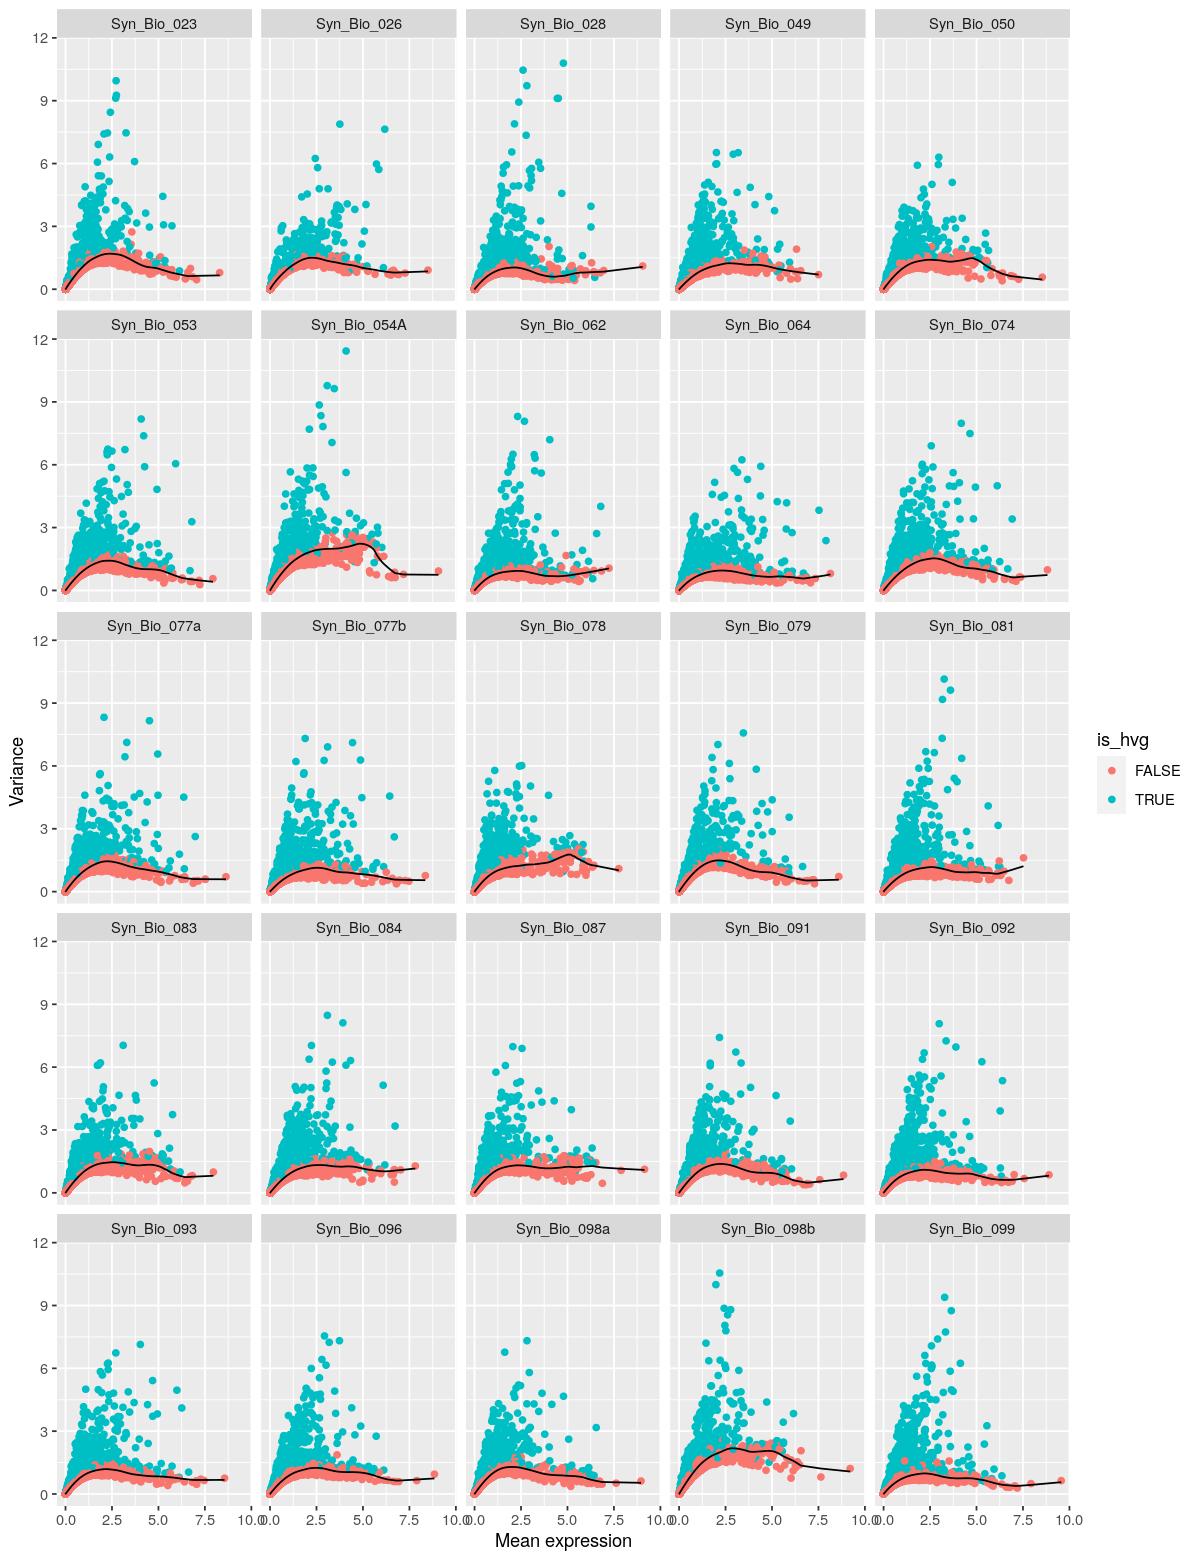
model per gene variance, get highly variable genes. Plot Mean vs. Variance of normalized log expression values.
bpstart(bpparam)
all_gene_var <-  modelGeneVar(syn_sce_tidy_filtered, block=syn_sce_tidy_filtered$Sample,
                              BPPARAM = bpparam)
bpstop(bpparam)
hvg <- getTopHVGs(all_gene_var, fdr.threshold=0.05)
length(hvg)
[1] 3290mean_var_comb <- map(unique(syn_sce_tidy_filtered$Sample), ~ {
all_gene_var$per.block[[.x]] %>%
as_tibble %>%
mutate(row_names = rownames(all_gene_var$per.block[[.x]]),
is_hvg = row_names %in% hvg,
Sample = .x)
}) %>%
purrr::reduce(rbind)
mean_var_comb %>%
ggplot() +
geom_point(aes(x = mean, y = total, color= is_hvg)) +
geom_line(aes(x=mean, y= tech)) +
labs(y="Variance",x="Mean expression") +
facet_wrap(~Sample)
Past versions of “gene var and feature selection-1.jpeg”
syn_sce_tidy_hvg <- syn_sce_tidy_filtered
rowData(syn_sce_tidy_hvg)$is_hvg <- rownames(syn_sce_tidy_hvg) %in% hvg
Plot set of detected genes (of HVG) for different conditions.
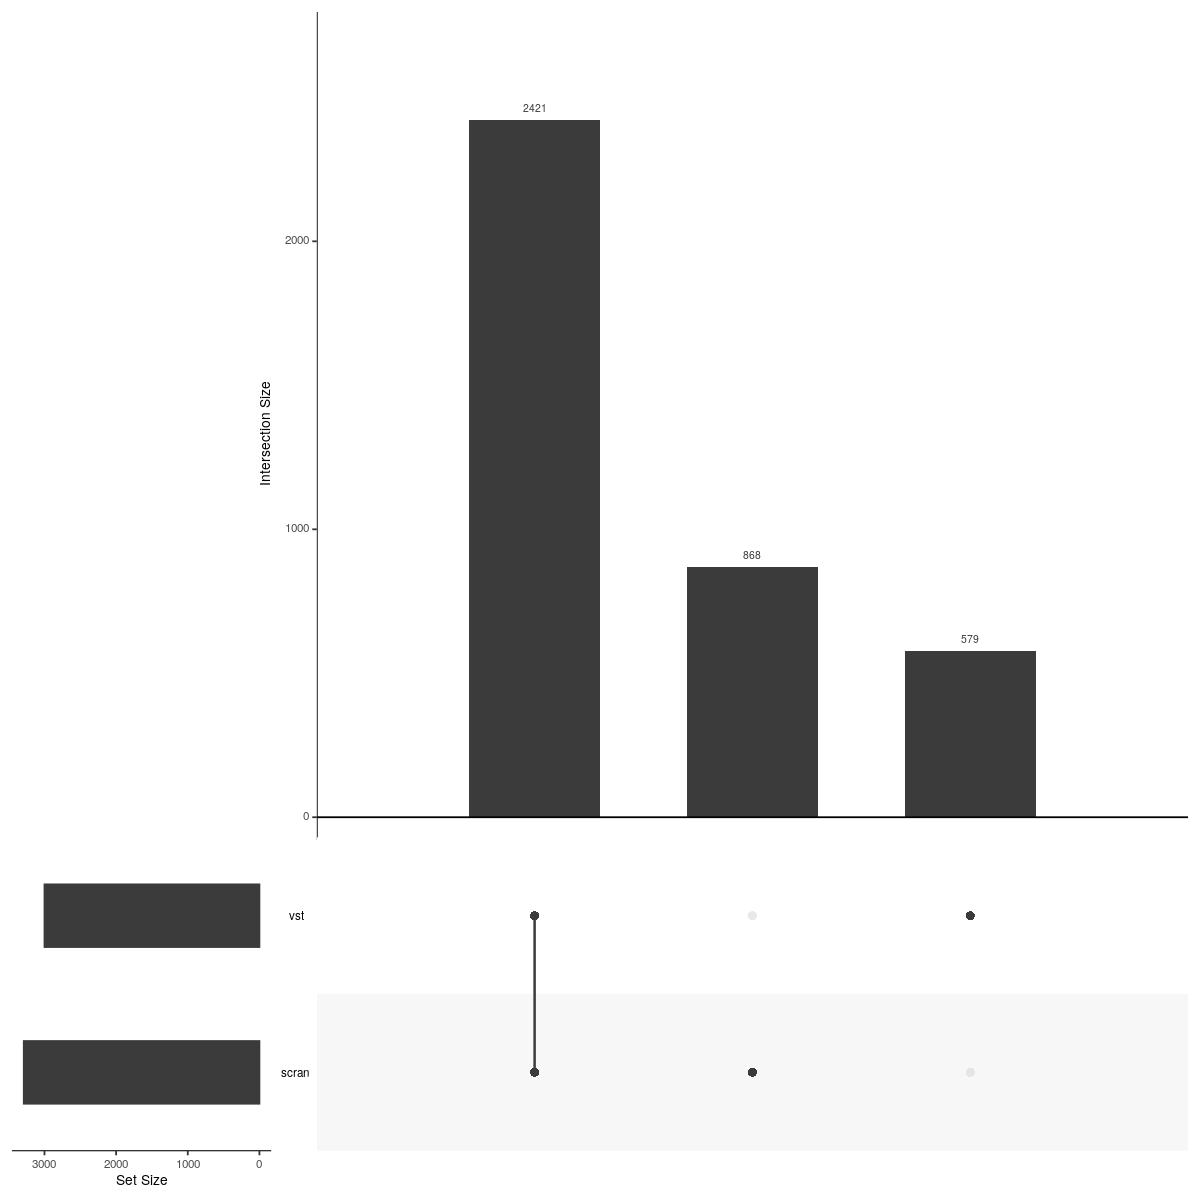
cat("### Upsetplot detected HVG {.tabset}\n\n")
Upsetplot detected HVG
cat("#### Unique Sample \n\n")
Unique Sample
  suppressMessages(suppressWarnings(capture.output({ tmpsce_nest_sample_unique <- syn_sce_tidy_hvg[rowData(syn_sce_tidy_hvg)$is_hvg,] %>%
    nest(data=-Sample)
  })))
character(0)
upsetdat_sample_unique <- purrr::map(seq_along(tmpsce_nest_sample_unique$data), ~{
    ind <- rowSums(counts(tmpsce_nest_sample_unique$data[[.x]]) >0 ) >0
    rownames(rowData(tmpsce_nest_sample_unique$data[[.x]]))[ind]
  })
names(upsetdat_sample_unique) <- tmpsce_nest_sample_unique$Sample
UpSetR::upset(UpSetR::fromList(upsetdat_sample_unique),nsets = length(upsetdat_sample_unique), nintersects = 20, order.by = "freq", mb.ratio = c(0.3,0.7))
Past versions of upsetplot-1.jpeg
cat("\n\n")cat("#### main Diagnosis \n\n")
main Diagnosis
  suppressMessages(suppressWarnings(capture.output({ tmpsce_nest_Diagnosis <- syn_sce_tidy_hvg[rowData(syn_sce_tidy_hvg)$is_hvg,] %>%
    nest(data=-Diagnosis)
  })))
character(0)
upsetdat_Diagnosis <- purrr::map(seq_along(tmpsce_nest_Diagnosis$data), ~{
    ind <- rowSums(counts(tmpsce_nest_Diagnosis$data[[.x]]) >0 ) >0
    rownames(rowData(tmpsce_nest_Diagnosis$data[[.x]]))[ind]
  })
names(upsetdat_Diagnosis) <- tmpsce_nest_Diagnosis$Diagnosis
UpSetR::upset(UpSetR::fromList(upsetdat_Diagnosis),nsets = length(upsetdat_Diagnosis), nintersects = 20, order.by = "freq", mb.ratio = c(0.3,0.7))
Past versions of upsetplot-2.jpeg
cat("\n\n")cat("### {-}")
Dimensionality reduction
use intrinsicDimension to get number of PC’s to keep. Run UMAP on reduced PCA.
sce_tmp <- syn_sce_tidy_hvg[rowData(syn_sce_tidy_hvg)$is_hvg,] %>%
  runPCA(name = "PCA")
ndims <- intrinsicDimension::maxLikGlobalDimEst(as.matrix(reducedDim(sce_tmp, "PCA")), k=20)
reducedDim(sce_tmp,"PCA_reduced") <- reducedDim(sce_tmp,"PCA")[,seq_len(ceiling(ndims$dim.est))]
reducedDimNames(sce_tmp)
[1] "PCA" "PCA_vst" "PCA_vst_reduced" "UMAP_vst"
[5] "UMAP_vst_reduced" "PCA_reduced" ncol(reducedDim(sce_tmp,"PCA_reduced"))[1] 16set.seed(100)
sce_tmp <- sce_tmp %>%
runUMAP(name = "UMAP", dimred = "PCA_reduced")
reducedDim(syn_sce_tidy_hvg,"PCA") <- reducedDim(sce_tmp,"PCA")
reducedDim(syn_sce_tidy_hvg,"PCA_reduced") <- reducedDim(sce_tmp,"PCA_reduced")
reducedDim(syn_sce_tidy_hvg,"UMAP") <- reducedDim(sce_tmp,"UMAP")Plot UMAP per sample.
n_sam <- length(unique(syn_sce_tidy_hvg$Sample))
splitind <- split(seq_len(n_sam),ceiling(seq(0.01,2.99,length.out = n_sam)))
colind <- unlist(purrr::map(seq_len(ceiling(n_sam/3)), ~ c(splitind[[1]][.x],splitind[[2]][.x],splitind[[3]][.x])))
colind <- colind[!is.na(colind)]
colors_used <- viridis::viridis(n_sam)[colind]
cat("### Dimred plots {.tabset}\n\n")
Dimred plots
cat("#### PCA\n\n")
PCA
plotReducedDim(syn_sce_tidy_hvg, "PCA_reduced", colour_by = "Sample") +
  scale_color_manual(values=colors_used)
Scale for 'colour' is already present. Adding another scale for 'colour',
which will replace the existing scale.
Past versions of “PCA color by sample-1.jpeg”
cat("#### UMAP\n\n")
UMAP
plotReducedDim(syn_sce_tidy_hvg, "UMAP", colour_by = "Sample") +
  scale_color_manual(values=colors_used)
Scale for 'colour' is already present. Adding another scale for 'colour',
which will replace the existing scale.
Past versions of “PCA color by sample-2.jpeg”
Version
Author
Date
7d99571
Reto Gerber
2022-03-21
9133ed1
Reto Gerber
2022-03-04
222b0d1
Reto Gerber
2021-07-29
cat("\n\n### {-}")