scRNAseq_complete_04-2_celltype_markers_subcelltypes
retogerber
2024-02-12
Last updated: 2024-02-12
Checks: 6 1
Knit directory: synovialscrnaseq/
This reproducible R Markdown analysis was created with workflowr (version 1.6.2). The Checks tab describes the reproducibility checks that were applied when the results were created. The Past versions tab lists the development history.
The R Markdown file has unstaged changes. To know which version of the R Markdown file created these results, you’ll want to first commit it to the Git repo. If you’re still working on the analysis, you can ignore this warning. When you’re finished, you can run wflow_publish to commit the R Markdown file and build the HTML.
Great job! The global environment was empty. Objects defined in the global environment can affect the analysis in your R Markdown file in unknown ways. For reproduciblity it’s best to always run the code in an empty environment.
The command set.seed(20210105) was run prior to running the code in the R Markdown file. Setting a seed ensures that any results that rely on randomness, e.g. subsampling or permutations, are reproducible.
Great job! Recording the operating system, R version, and package versions is critical for reproducibility.
Nice! There were no cached chunks for this analysis, so you can be confident that you successfully produced the results during this run.
Great job! Using relative paths to the files within your workflowr project makes it easier to run your code on other machines.
Great! You are using Git for version control. Tracking code development and connecting the code version to the results is critical for reproducibility.
The results in this page were generated with repository version 58eeb06. See the Past versions tab to see a history of the changes made to the R Markdown and HTML files.
Note that you need to be careful to ensure that all relevant files for the analysis have been committed to Git prior to generating the results (you can use wflow_publish or wflow_git_commit). workflowr only checks the R Markdown file, but you know if there are other scripts or data files that it depends on. Below is the status of the Git repository when the results were generated:
Ignored files:
    Ignored:    '/
    Ignored:    .Rhistory
    Ignored:    .Rproj.user/
    Ignored:    .empty/
    Ignored:    analysis/.Rhistory
    Ignored:    analysis/iSEE_interactive_document.html
    Ignored:    code/test_files/
    Ignored:    data/Culemann/
    Ignored:    data/E-MTAB-8322/
    Ignored:    data/Synovial scRNA-seq samples - Sheet1.csv
    Ignored:    data/Zhang_top20_singlecell_cluster_markers_fromGithub.csv
    Ignored:    data/findMarkers_results.rds
    Ignored:    data/findMarkers_results_v2.rds
    Ignored:    data/info/
    Ignored:    data/syn_sce_tidy_filtered.rds
    Ignored:    data/syn_sce_tidy_hvg.rds
    Ignored:    data/syn_sce_tidy_hvg_cms.rds
    Ignored:    docs/
    Ignored:    output/Figures_Paper/
    Ignored:    output/Sample_summaries_RA_comparisons.rds
    Ignored:    output/Sample_summaries_direct_dissociation.rds
    Ignored:    output/Sample_summaries_exvivo_treatment.rds
    Ignored:    output/Suppl_Figure_4d.rds
    Ignored:    output/barcodes.txt
    Ignored:    output/barcodes_filtered.txt
    Ignored:    output/column_metadata_filtered.txt
    Ignored:    output/combined_v7_SingleR_markers.rds
    Ignored:    output/combined_v7_SingleR_predictions.rds
    Ignored:    output/combined_v7_SingleR_predictions_lclc.rds
    Ignored:    output/combined_v7_SingleR_predictions_reclc.rds
    Ignored:    output/combined_v7_SingleR_predictions_recrec.rds
    Ignored:    output/combined_v7_SingleR_trained.rds
    Ignored:    output/combined_v7_sce.rds
    Ignored:    output/combined_v7_sce_filtered.rds
    Ignored:    output/combined_v7_sce_hvg.rds
    Ignored:    output/combined_v7_sce_hvg_cms.rds
    Ignored:    output/combined_v7_sce_hvg_cms_annotated.rds
    Ignored:    output/combined_v7_sce_tmp_hvg_cms.rds
    Ignored:    output/combined_v7_upsetplot_genelists.rds
    Ignored:    output/count_matrix_filtered.mtx
    Ignored:    output/count_matrix_unfiltered.mtx
    Ignored:    output/emptyDrops_result_v4.rds
    Ignored:    output/emptyDrops_result_v4_tmp.rds
    Ignored:    output/emptyDrops_result_v4tmptmp.rds
    Ignored:    output/findMarkers_results_v6.rds
    Ignored:    output/findMarkers_results_v6_ec.rds
    Ignored:    output/findMarkers_results_v6_main.rds
    Ignored:    output/findMarkers_results_v6_mp.rds
    Ignored:    output/findMarkers_results_v6_sf.rds
    Ignored:    output/findMarkers_results_v6_tc.rds
    Ignored:    output/findMarkers_results_v7_ec.rds
    Ignored:    output/findMarkers_results_v7_main.rds
    Ignored:    output/findMarkers_results_v7_mp.rds
    Ignored:    output/findMarkers_results_v7_sf.rds
    Ignored:    output/findMarkers_results_v7_tc.rds
    Ignored:    output/genes.txt
    Ignored:    output/genes_filtered.txt
    Ignored:    output/goana_results_v6_ec.rds
    Ignored:    output/goana_results_v6_mp.rds
    Ignored:    output/preprocessing_number_of_cells.rds
    Ignored:    output/syn_v4_sce_emptyDrops_invivo.rds
    Ignored:    output/syn_v4_swappedDrops_24300_after.rds
    Ignored:    output/syn_v4_swappedDrops_24300_before.rds
    Ignored:    output/syn_v4_swappedDrops_24793_after.rds
    Ignored:    output/syn_v4_swappedDrops_24793_before.rds
    Ignored:    output/syn_v6_cluster_cellid_match_invivo.rds
    Ignored:    output/syn_v6_clustering_lookup_invivo.rds
    Ignored:    output/syn_v6_clustering_lookup_multiple_invivo.rds
    Ignored:    output/syn_v6_sce.rds
    Ignored:    output/syn_v6_sce_Figure8.rds
    Ignored:    output/syn_v6_sce_Figure8_dic_ls.rds
    Ignored:    output/syn_v6_sce_ec_invivo.rds
    Ignored:    output/syn_v6_sce_filtered_invivo.rds
    Ignored:    output/syn_v6_sce_hdf5/
    Ignored:    output/syn_v6_sce_hvg_cms_doublet_invivo.rds
    Ignored:    output/syn_v6_sce_hvg_cms_doublet_subcluster_invivo.rds
    Ignored:    output/syn_v6_sce_hvg_invivo.rds
    Ignored:    output/syn_v6_sce_hvg_marker_genes.rds
    Ignored:    output/syn_v6_sce_mp_invivo.rds
    Ignored:    output/syn_v6_sce_sf_invivo.rds
    Ignored:    output/syn_v6_sce_tc_invivo.rds
    Ignored:    output/syn_v6_sfig1.rds
    Ignored:    output/syn_v6_vst_out_invivo.rds
    Ignored:    output/syn_v7_cluster_cellid_match_invivo.rds
    Ignored:    output/syn_v7_clustering_lookup_invivo.rds
    Ignored:    output/syn_v7_clustering_lookup_multiple_invivo.rds
    Ignored:    output/syn_v7_sce.rds
    Ignored:    output/syn_v7_sce_Figure8.rds
    Ignored:    output/syn_v7_sce_Figure8_dic_ls.rds
    Ignored:    output/syn_v7_sce_ec_invivo.rds
    Ignored:    output/syn_v7_sce_ec_invivo_trajectory.rds
    Ignored:    output/syn_v7_sce_ec_invivo_trajectory2.rds
    Ignored:    output/syn_v7_sce_ec_invivo_trajectory2_ATres.rds
    Ignored:    output/syn_v7_sce_ec_invivo_trajectory_icMat.rds
    Ignored:    output/syn_v7_sce_filtered_invivo.rds
    Ignored:    output/syn_v7_sce_hdf5/
    Ignored:    output/syn_v7_sce_hvg_cms_doublet_invivo.rds
    Ignored:    output/syn_v7_sce_hvg_cms_doublet_subcluster_invivo.rds
    Ignored:    output/syn_v7_sce_hvg_cms_doublet_subcluster_invivo_cleaned.rds
    Ignored:    output/syn_v7_sce_hvg_invivo.rds
    Ignored:    output/syn_v7_sce_mp_invivo.rds
    Ignored:    output/syn_v7_sce_sf_invivo.rds
    Ignored:    output/syn_v7_sce_tc_invivo.rds
    Ignored:    output/syn_v7_sfig1.rds
    Ignored:    output/syn_v7_vst_out_invivo.rds

Untracked files:
    Untracked:  analysis/clean_and_save_sce.R
    Untracked:  analysis/description_integration_wei_stephenson
    Untracked:  analysis/scRNAseq_complete_01_preprocessing_comparison.Rmd
    Untracked:  analysis/scRNAseq_complete_05_ec_trajectory_analysis.Rmd
    Untracked:  analysis/scRNAseq_complete_05_ec_trajectory_analysis_2.Rmd
    Untracked:  analysis/scRNAseq_complete_05_ec_trajectory_analysis_3.Rmd
    Untracked:  code/plot_utilities.Rmd
    Untracked:  code/rebuild_ezRun.R
    Untracked:  code/tmp1.R
    Untracked:  code/tmp1.Rmd
    Untracked:  nonhosted_public/
    Untracked:  singRstudio.sh.bak

Unstaged changes:
    Modified:   analysis/scRNAseq_combined_06_Figures.Rmd
    Modified:   analysis/scRNAseq_complete_04-2_celltype_markers.Rmd
    Modified:   analysis/scRNAseq_complete_04-2_celltype_markers_subcelltypes.Rmd
    Modified:   analysis/scRNAseq_complete_04_Annotation_v7.Rmd
    Modified:   analysis/scRNAseq_complete_Figures.Rmd
    Modified:   analysis/write_tsv.Rmd
    Modified:   code/create_hdf5.R
Note that any generated files, e.g. HTML, png, CSS, etc., are not included in this status report because it is ok for generated content to have uncommitted changes.
These are the previous versions of the repository in which changes were made to the R Markdown (analysis/scRNAseq_complete_04-2_celltype_markers_subcelltypes.Rmd) and HTML (public/scRNAseq_complete_04-2_celltype_markers_subcelltypes.html) files. If you’ve configured a remote Git repository (see ?wflow_git_remote), click on the hyperlinks in the table below to view the files as they were in that past version.
| File | Version | Author | Date | Message |
|---|---|---|---|---|
| Rmd | 58eeb06 | Reto Gerber | 2023-05-30 | add new version |
| html | 58eeb06 | Reto Gerber | 2023-05-30 | add new version |
| Rmd | 4575ba6 | Reto Gerber | 2022-12-21 | Update analyis |
| Rmd | e786402 | Reto Gerber | 2022-05-28 | update figures to final version of paper |
| html | e786402 | Reto Gerber | 2022-05-28 | update figures to final version of paper |
| Rmd | 0f8368f | Reto Gerber | 2022-05-20 | update figures |
| html | 0f8368f | Reto Gerber | 2022-05-20 | update figures |
| Rmd | 5a6aa2a | Reto Gerber | 2022-04-25 | rerun with small resolution |
| html | 5a6aa2a | Reto Gerber | 2022-04-25 | rerun with small resolution |
| Rmd | 3443cc6 | Reto Gerber | 2022-04-25 | Update |
| html | 3443cc6 | Reto Gerber | 2022-04-25 | Update |
| Rmd | b5b139f | Reto Gerber | 2022-03-29 | Update analysis |
| html | b5b139f | Reto Gerber | 2022-03-29 | Update analysis |
| Rmd | 7d99571 | Reto Gerber | 2022-03-21 | update analysis |
| html | 7d99571 | Reto Gerber | 2022-03-21 | update analysis |
Set up
suppressPackageStartupMessages({
  library(magrittr)
  library(SingleCellExperiment)
  library(scater)
  library(scran)
  library(scuttle)
  library(magrittr)
})
n_workers <- 10
RhpcBLASctl::blas_set_num_threads(n_workers)

remove_low_quality_samples <- TRUE
analysis_version <- 7
source(here::here("code","utilities_plots.R"))

here::here()
[1] "/home/retger/Synovial/synovialscrnaseq"set.seed(100)
hm_ls <- list()get_celltype_centers <- function(sce, dimred, column){
as.data.frame(reducedDim(sce,"UMAP_corrected")) %>%
dplyr::mutate(V3=sce[[column]]) %>%
dplyr::group_by(V3) %>%
dplyr::summarise(V1=mean(as.numeric(V1)),
V2=mean(as.numeric(V2)))
}
# move center of column
move_label <- function(celltype_centers,val=0, ax="X", what=NULL){
if(is.null(what)){
if(ax=="X"){
celltype_centers$V1 <- celltype_centers$V1 + val
} else if(ax=="Y"){
celltype_centers$V2 <- celltype_centers$V2 + val
}
} else {
stopifnot(what %in% celltype_centers$V3)
if(ax=="X"){
celltype_centers$V1[celltype_centers$V3 == what] <- celltype_centers$V1[celltype_centers$V3 == what] + val
} else if(ax=="Y"){
celltype_centers$V2[celltype_centers$V3 == what] <- celltype_centers$V2[celltype_centers$V3 == what] + val
}
}
celltype_centers
}findMarkers - SF
celltype_name_pre <- "sf"
# order_celltypes <- c(5,4,2,6,8,1,7,3)
used_clustering <- "sf_clusters_final"
# order_celltypes <- NULL
order_celltypes <- c(3,7,5,4,6,1,2)
tmpfilename <- paste0("syn_v",analysis_version,"_sce_",celltype_name_pre,dplyr::if_else(remove_low_quality_samples, "_invivo",""),".rds")
sce_sub <- readRDS(file = here::here("output",tmpfilename))
if(is.null(sce_sub[[paste0(celltype_name_pre,"_celltype")]])){
sce_sub[[paste0(celltype_name_pre,"_clusters_final")]] <- as.integer(sce_sub[[used_clustering]])
sce_sub[[paste0(celltype_name_pre,"_celltype")]] <- as.integer(sce_sub[[paste0(celltype_name_pre,"_clusters_final")]])
}Loading required package: tidySingleCellExperiment
Attaching package: 'tidySingleCellExperiment'The following object is masked from 'package:IRanges':
sliceThe following object is masked from 'package:S4Vectors':
renameThe following object is masked from 'package:matrixStats':
countThe following object is masked from 'package:magrittr':
extractThe following object is masked from 'package:stats':
filterif(is.null(order_celltypes)){
order_celltypes <- sort(unique(sce_sub[[paste0(celltype_name_pre,"_celltype")]]))
}format(object.size(sce_sub),units="Mb")[1] "2523.9 Mb"colLabels(sce_sub) <- colData(sce_sub)[[paste0(celltype_name_pre,"_celltype")]]
sce_sub_red <- sce_sub
sce_sub_red <- sce_sub_red[rowData(sce_sub_red)$is_hvg,]
colData(sce_sub_red) <- NULL
rowData(sce_sub_red) <- NULL
counts(sce_sub_red) <- NULL
assay(sce_sub_red,"reconstructed") <- NULL
metadata(sce_sub_red) <- list()
reducedDims(sce_sub_red) <- list()
colLabels(sce_sub_red) <- colData(sce_sub)[[paste0(celltype_name_pre,"_celltype")]]
as(sce_sub_red, "SingleCellExperiment")class: SingleCellExperiment
dim: 2614 30432
metadata(0):
assays(1): logcounts
rownames(2614): SAMD11 HES4 ... MT-ND3 MAFIP
rowData names(0):
colnames(30432): Syn_Bio_079.AAACCCATCAAAGCCT
Syn_Bio_079.AAACGAAAGAAGTCCG ... Syn_Bio_050.TTTGGAGTCATCCTGC-1
Syn_Bio_050.TTTGGTTAGGTAACTA-1
colData names(1): label
reducedDimNames(0):
altExpNames(0):format(object.size(sce_sub_red),units="Mb")[1] "171.8 Mb"markers <- findMarkers(sce_sub_red, test.type = "wilcox", pval.type = "all", direction="up",
lfc=0.5, block=sce_sub$Sample)
saveRDS(markers,here::here("output",paste0("findMarkers_results_v",analysis_version,"_",celltype_name_pre,".rds")))Heatmap - SF
markers <- readRDS(here::here("output",paste0("findMarkers_results_v",analysis_version,"_",celltype_name_pre,".rds")))topmarkers <- purrr::map(seq_along(markers), function(i){
markers[[i]] %>%
as.data.frame() %>%
dplyr::arrange(FDR) %>%
dplyr::select(FDR) %>%
head(n=10)
})
names(topmarkers) <- names(markers)
topmarkers$`CADM1high ACAN+ DKK3+`
FDR
COL12A1 1.777646e-69
FNDC1 3.038790e-50
TPM1 1.838642e-35
ACAN 5.475484e-26
COMP 2.565001e-25
ASPN 4.216189e-25
TAGLN 2.658597e-19
POSTN 2.826811e-17
SFRP4 1.061789e-09
COL1A2 2.864558e-07
$`GGT5high CXCL12 high FGF7+`
FDR
CXCL12 3.986291e-53
IGFBP4 4.401633e-25
IER3 9.221636e-14
CFH 8.178939e-12
PTGFR 1.112774e-02
EGR1 1.283421e-01
GGT5 8.528055e-01
JUNB 1.000000e+00
KLF9 1.000000e+00
ZFP36L1 1.000000e+00
$`HLA-DRAhigh CD74+`
FDR
CHI3L2 1.706008e-175
CHI3L1 1.000000e+00
FTH1 1.000000e+00
PLTP 1.000000e+00
SOD2 1.000000e+00
ENAH 1.000000e+00
LUM 1.000000e+00
ID2 1.000000e+00
TNC 1.000000e+00
SLC38A2 1.000000e+00
$`MMP13+`
FDR
SOX4 1
KLF6 1
JUN 1
CCN5 1
BNC2 1
MAP4K4 1
MAFB 1
RORA 1
EMILIN1 1
MDK 1
$`PRG4+ CD55+ TWISTNB+ lining SF`
FDR
PRG4 1.018388e-178
TIMP3 1.785080e-127
CD55 8.158007e-125
ITGB8 7.615618e-100
HTRA1 8.230421e-100
GFPT2 1.055650e-96
UAP1 2.753885e-78
HBEGF 1.150714e-75
HAS1 2.375721e-72
CRTAC1 4.528893e-68
$`SERPINE1+ COL5A3+ LOXL2high`
FDR
TPM2 3.352091e-26
TGFBI 2.054128e-15
LOXL2 1.328124e-05
COL5A3 8.969596e-04
TNFRSF12A 9.575967e-01
LTBP2 1.000000e+00
ITGA5 1.000000e+00
TUBA1B 1.000000e+00
S100A16 1.000000e+00
SLC20A1 1.000000e+00
$`TNXBhigh IGFBP6+ FGFBP2+`
FDR
MFAP5 2.001058e-15
FBN1 1.563059e-09
TNXB 4.454351e-04
IGFBP6 7.697037e-04
LTBP4 1.393670e-02
FSTL1 1.000000e+00
ADIRF 1.000000e+00
CD248 1.000000e+00
AQP1 1.000000e+00
HTRA3 1.000000e+00column <- paste0(celltype_name_pre,"_clusters_final")
column_labels <- paste0(celltype_name_pre,"_celltype")
sce_sub[[column]] <- factor(sce_sub[[column]],levels = order_celltypes)
dic <- unique(as.data.frame(colData(sce_sub)[,c(column,column_labels)])) %>%
dplyr::arrange(!!dplyr::sym(column))
# subcelltype_colors <- viridis::viridis(length(dic[[column]]))
subcelltype_colors <- rainbow(length(dic[[column]]))[order(as.character(dic[[column]]))]
names(subcelltype_colors) <- dic[[column]]
column_names <- paste0(dic[[column]], " - ",dic[[column_labels]])
dic$colors <- subcelltype_colors
dic$column_names <- column_names
markergenes_ls <- purrr::map(topmarkers[dic[[paste0(celltype_name_pre,"_celltype")]]],~rownames(.x))
markergenes_ls <- markergenes_ls
names(markergenes_ls) <- names(markergenes_ls) #%>% stringr::str_replace_all("/","\n")
markergenes_ls[[1]] <- c("THY1",markergenes_ls[[1]])
markergenes_n <- purrr::map(markergenes_ls, ~length(.x))
markergenes <- unlist(markergenes_ls)clusters <- sce_sub[[paste0(celltype_name_pre,"_clusters_final")]]
clucol <- dic$colors
names(clucol) <- dic$column_names
samples <- sce_sub$Sample
samcol <- sample_cols(unique(samples))
names(samcol) <- unique(samples)
diagnosis <- sce_sub$Diagnosis_main
diagcol <- get_colors("diagnosis")
diagcol <- diagcol[names(diagcol) %in% unique(sce_sub$Diagnosis_main)]
clusters_samples <- paste0(clusters,"-",diagnosis,"-", samples)
mataggr <- summarizeAssayByGroup(logcounts(sce_sub),clusters_samples, subset.row=markergenes)
tmpcoldat <- colData(sce_sub) %>%
as.data.frame() %>%
dplyr::mutate(tmp_clusters_final=!!dplyr::sym(paste0(celltype_name_pre,"_clusters_final"))) %>%
dplyr::left_join(data.frame(tmp_clusters_final=factor(order_celltypes),
tmp_celltype_order=seq_along(unique(sce_sub[[paste0(celltype_name_pre,"_clusters_final")]]))),
by="tmp_clusters_final") %>%
dplyr::arrange(tmp_celltype_order, Diagnosis_main, Sample)
order_samples <- tmpcoldat %>%
dplyr::select(tmp_clusters_final, Diagnosis_main, Sample) %>%
unique() %>%
dplyr::mutate(tmpname=paste0(stringr::str_replace_all(tmp_clusters_final,"/","\n"),"-",Diagnosis_main,"-", Sample)) %>%
dplyr::pull()
mataggr <- mataggr[,order_samples]
colnamessplit <- stringr::str_split(colnames(mataggr),"-")
clustersaggr <- purrr::map_chr(colnamessplit,~.x[1])
diagcolsaggr <- purrr::map_chr(colnamessplit,~.x[2])
samplesaggr <- purrr::map_chr(colnamessplit,~.x[3])
tmpass <- t(apply(assay(mataggr,"mean"),1,scale))
colnames(tmpass) <- colnames(assay(mataggr,"mean"))
assay(mataggr,"mean_scale") <- tmpass
order_samples <- colnames(mataggr)[order(colnames(mataggr))]
library(ComplexHeatmap)Loading required package: grid========================================
ComplexHeatmap version 2.6.2
Bioconductor page: http://bioconductor.org/packages/ComplexHeatmap/
Github page: https://github.com/jokergoo/ComplexHeatmap
Documentation: http://jokergoo.github.io/ComplexHeatmap-reference
If you use it in published research, please cite:
Gu, Z. Complex heatmaps reveal patterns and correlations in multidimensional
genomic data. Bioinformatics 2016.
This message can be suppressed by:
suppressPackageStartupMessages(library(ComplexHeatmap))
========================================ha <- ComplexHeatmap::HeatmapAnnotation(
`Cell type` = factor(
clustersaggr,
levels = unique(clustersaggr),
labels = paste0(unique(clustersaggr)," - ",purrr::map_chr(unique(clustersaggr), ~dic[[paste0(celltype_name_pre,"_celltype")]][dic[[paste0(celltype_name_pre,"_clusters_final")]] == .x]))),
# Diagnosis=diagcolsaggr,
Sample = samplesaggr,
col=list(`Cell type`=clucol,Sample=samcol,Diagnosis=diagcol),
annotation_legend_param=list(labels_gp = gpar(fontsize=16),
title_gp = gpar(fontsize=20,fontface="bold")))
ht_opt$TITLE_PADDING = unit(c(4, 20), "points")
ht <- ComplexHeatmap::Heatmap(
assay(mataggr,"mean_scale"),
heatmap_legend_param = list(title = "Scaled expression",fontsize=20,gap=unit(20, "mm"),
labels_gp = gpar(fontsize=16),
title_gp = gpar(fontsize=20,fontface="bold")),
cluster_rows = FALSE,
cluster_columns=FALSE,
column_order=order_samples,
show_column_names=FALSE,
column_split=factor(clustersaggr,levels = unique(clustersaggr)),
column_title = NULL,
column_gap = unit(0.2, "mm"),
row_split=factor(unlist(purrr::map(seq_along(markergenes_n),~rep(names(markergenes_n)[.x],markergenes_n[[.x]]))),
levels = unique(clustersaggr)),
row_title = NULL
)
hm_ls[[celltype_name_pre]] <- ha %v% ht
hm_ls[[celltype_name_pre]] 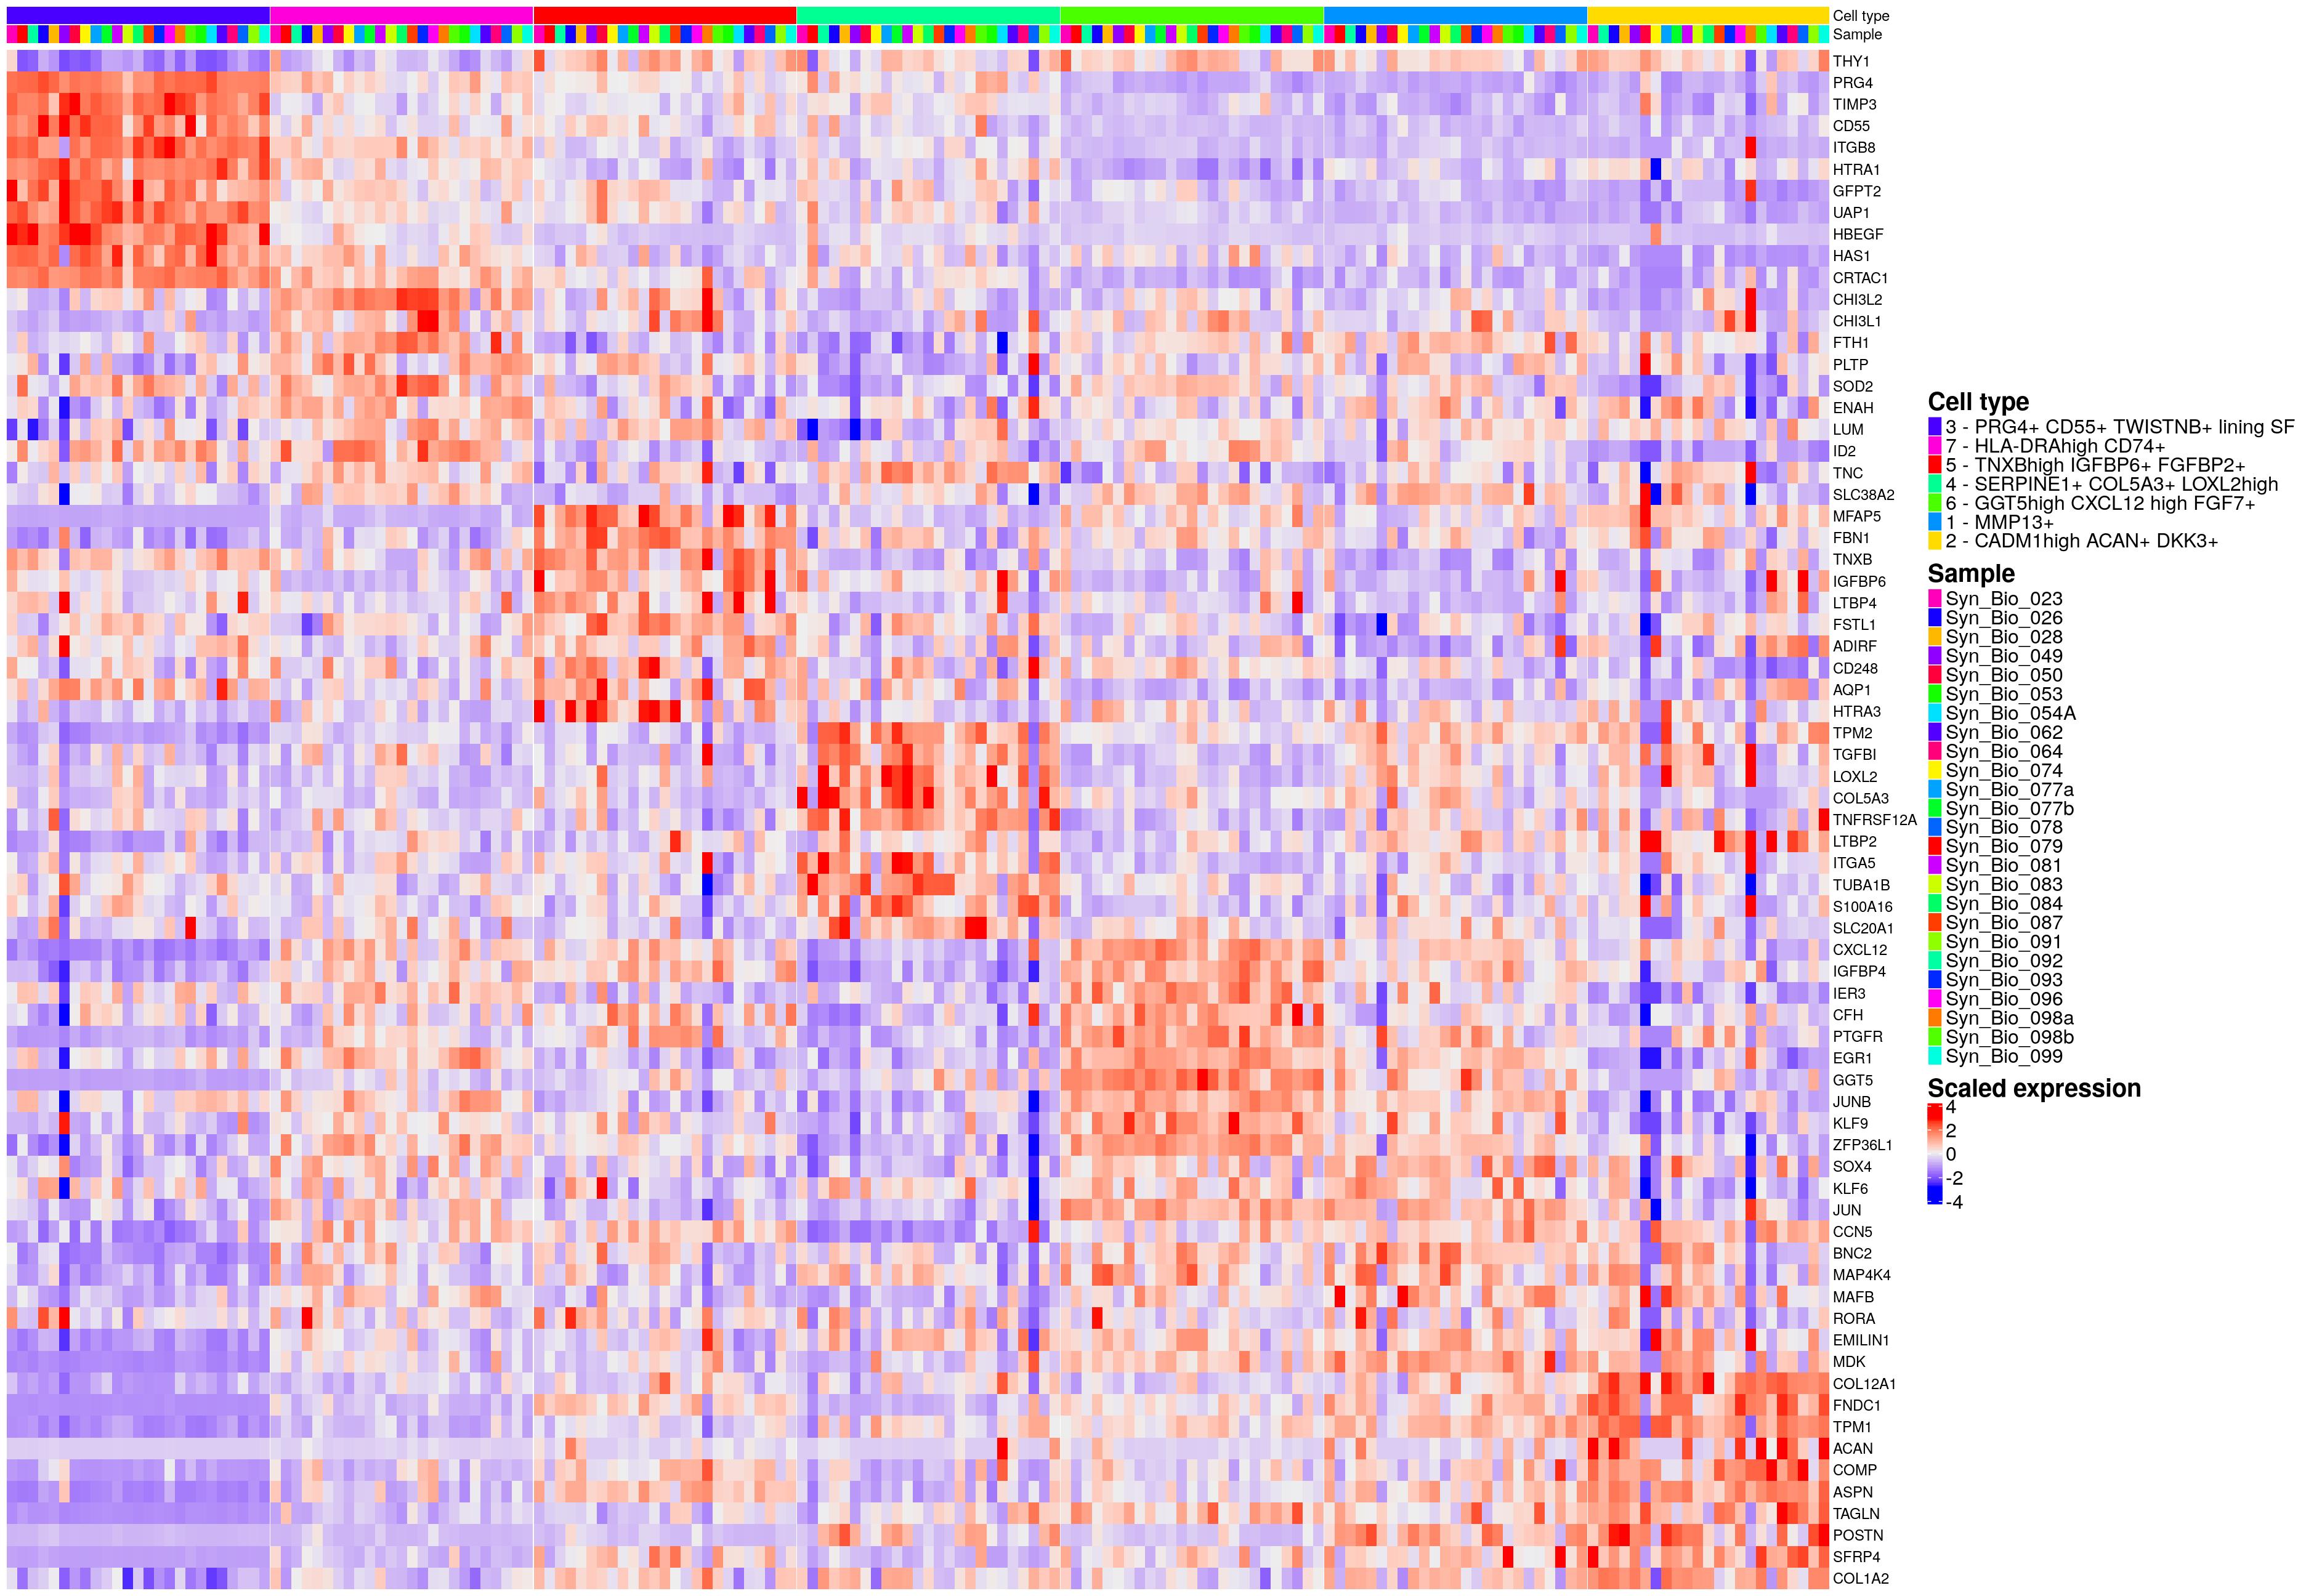
# order_celltypes <- c(5,4,2,8,1,7,3,6)
# order_celltypes <- NULL
order_celltypes <- c(3,7,5,4,6,1,2)if(is.null(sce_sub[[paste0(celltype_name_pre,"_celltype")]])){
sce_sub[[paste0(celltype_name_pre,"_clusters_final")]] <- as.integer(sce_sub[[used_clustering]])
sce_sub[[paste0(celltype_name_pre,"_celltype")]] <- as.integer(sce_sub[[paste0(celltype_name_pre,"_clusters_final")]])
}
if(is.null(order_celltypes)){
  order_celltypes <- sort(unique(sce_sub[[paste0(celltype_name_pre,"_celltype")]]))
}
column <- paste0(celltype_name_pre,"_clusters_final")
column_labels <- paste0(celltype_name_pre,"_celltype")
sce_sub[[column]] <- factor(sce_sub[[column]],levels = order_celltypes)
dic <- unique(as.data.frame(colData(sce_sub)[,c(column,column_labels)])) %>%
dplyr::arrange(!!dplyr::sym(column))
# subcelltype_colors <- viridis::viridis(length(dic[[column]]))
subcelltype_colors <- rainbow(length(dic[[column]]))[order(as.character(dic[[column]]))]
names(subcelltype_colors) <- dic[[column]]
column_names <- paste0(dic[[column]], " - ",dic[[column_labels]])
dic$colors <- subcelltype_colors
dic$column_names <- column_names
markergenes_ls <- list(
`3` = c("COL1A1", "COL1A2", "PDPN"),
`7` = c("PRG4", "CD55", "ITGB8", "MMP1", "HBEGF", "TWISTNB", "ITGBL1",
"CLIC5", "TMEM196", "PGF", "ZNF385B", "GABRA4", "GJB2", "FAM49A",
"SEMA3A", "SEMA5A", "SLC2A12", "FGF10", "GPR1", "CXCL6", "CITED2",
"PCSK6", "VEGFC", "CHST2", "RELL1", "NTN4", "ANK3", "C10orf105",
"HAS1", "SMIM14", "CXCL1", "INHBA", "GPX3", "ERRFI1", "MMP3",
"CLU", "TIMP3", "CRTAC1", "HTRA1", "SEMA3C", "DEFB1", "IGFBP5",
"UAP1", "SOX5", "SLC7A2", "RCAN1", "ADAMTS5"),
`4` = c("CD74", "HLA-DRA", "HLA-DRB1", "HLA-DPB1", "PLTP", "CHI3L1",
"LUM", "PHLDA1"),
`6` = c("TNXB", "IGFBP6", "FGFBP2", "CD34", "DPP4", "MFAP5", "ADIRF",
"FSTL1", "ELN"),
`1` = c("SERPINE1", "LOXL2", "ANPEP", "COL4A1", "TGFBI", "TGFB1", "COL5A3",
"PHLDA2", "SLC16A3", "IGFBP3", "TPM2", "S100A16", "SLC20A1",
"LTBP2"),
`2` = c("SFRP1", "APOE", "IL6", "CXCL2", "GGT5", "FGF7", "CXCL12",
"NOTCH3", "CXCL14", "C3", "GAS6", "ID4", "AHR", "RASD1", "TMEM176A",
"TMEM176B", "IGFBP4", "VCAN"),
`8` = c("MMP13", "CADM1", "ACAN", "DKK3", "POSTN", "COL12A1", "COMP", "FNDC1",
"SFRP4", "SCX", "PTN", "LRRC17", "GXYLT2", "EDIL3", "TPM1", "TAGLN",
"ASPN", "LHFPL6")
)
for (i in seq_along(markergenes_ls)) {
markergenes_ls[[i]] <- markergenes_ls[[i]][markergenes_ls[[i]] %in% rownames(sce_sub)]
}
markergenes_n <- purrr::map(markergenes_ls, ~length(.x))
markergenes <- unlist(markergenes_ls)
tmp_figure_sf <- hm_ls[["sf"]]clusters <- sce_sub[[paste0(celltype_name_pre,"_clusters_final")]]
clucol <- dic$colors
names(clucol) <- dic$column_names
samples <- sce_sub$Sample
samcol <- sample_cols(unique(samples))
names(samcol) <- unique(samples)
diagnosis <- sce_sub$Diagnosis_main
diagcol <- get_colors("diagnosis")
diagcol <- diagcol[names(diagcol) %in% unique(sce_sub$Diagnosis_main)]
clusters_samples <- paste0(clusters,"-",diagnosis,"-", samples)
mataggr <- summarizeAssayByGroup(logcounts(sce_sub),clusters_samples, subset.row=markergenes)
tmpcoldat <- colData(sce_sub) %>%
as.data.frame() %>%
dplyr::mutate(tmp_clusters_final=!!dplyr::sym(paste0(celltype_name_pre,"_clusters_final"))) %>%
dplyr::left_join(data.frame(tmp_clusters_final=factor(order_celltypes),
tmp_celltype_order=seq_along(unique(sce_sub[[paste0(celltype_name_pre,"_clusters_final")]]))),
by="tmp_clusters_final") %>%
dplyr::arrange(tmp_celltype_order, Diagnosis_main, Sample)
order_samples <- tmpcoldat %>%
dplyr::select(tmp_clusters_final, Diagnosis_main, Sample) %>%
unique() %>%
dplyr::mutate(tmpname=paste0(stringr::str_replace_all(tmp_clusters_final,"/","\n"),"-",Diagnosis_main,"-", Sample)) %>%
dplyr::pull()
mataggr <- mataggr[,order_samples]
colnamessplit <- stringr::str_split(colnames(mataggr),"-")
clustersaggr <- purrr::map_chr(colnamessplit,~.x[1])
diagcolsaggr <- purrr::map_chr(colnamessplit,~.x[2])
samplesaggr <- purrr::map_chr(colnamessplit,~.x[3])
tmpass <- t(apply(assay(mataggr,"mean"),1,scale))
colnames(tmpass) <- colnames(assay(mataggr,"mean"))
assay(mataggr,"mean_scale") <- tmpass
order_samples <- colnames(mataggr)[order(colnames(mataggr))]
library(ComplexHeatmap)
ha <- ComplexHeatmap::HeatmapAnnotation(
`Cell type` = factor(
clustersaggr,
levels = unique(clustersaggr),
labels = paste0(unique(clustersaggr)," - ",purrr::map_chr(unique(clustersaggr), ~dic[[paste0(celltype_name_pre,"_celltype")]][dic[[paste0(celltype_name_pre,"_clusters_final")]] == .x]))),
# Diagnosis=diagcolsaggr,
Sample = samplesaggr,
col=list(`Cell type`=clucol,Sample=samcol,Diagnosis=diagcol),
annotation_legend_param=list(labels_gp = gpar(fontsize=16),
title_gp = gpar(fontsize=20,fontface="bold")))
ht_opt$TITLE_PADDING = unit(c(4, 20), "points")
ht <- ComplexHeatmap::Heatmap(
assay(mataggr,"mean_scale"),
heatmap_legend_param = list(title = "Scaled expression",fontsize=20,gap=unit(20, "mm"),
labels_gp = gpar(fontsize=16),
title_gp = gpar(fontsize=20,fontface="bold")),
cluster_rows = FALSE,
cluster_columns=FALSE,
column_order=order_samples,
show_column_names=FALSE,
column_split=factor(clustersaggr,levels = unique(clustersaggr)),
column_title = NULL,
column_gap = unit(0.2, "mm"),
row_split=factor(unlist(purrr::map(seq_along(markergenes_n),~rep(names(markergenes_n)[.x],markergenes_n[[.x]]))),
levels = unique(clustersaggr)),
row_title = NULL
)
hm_ls[[celltype_name_pre]] <- ha %v% ht
hm_ls[[celltype_name_pre]] 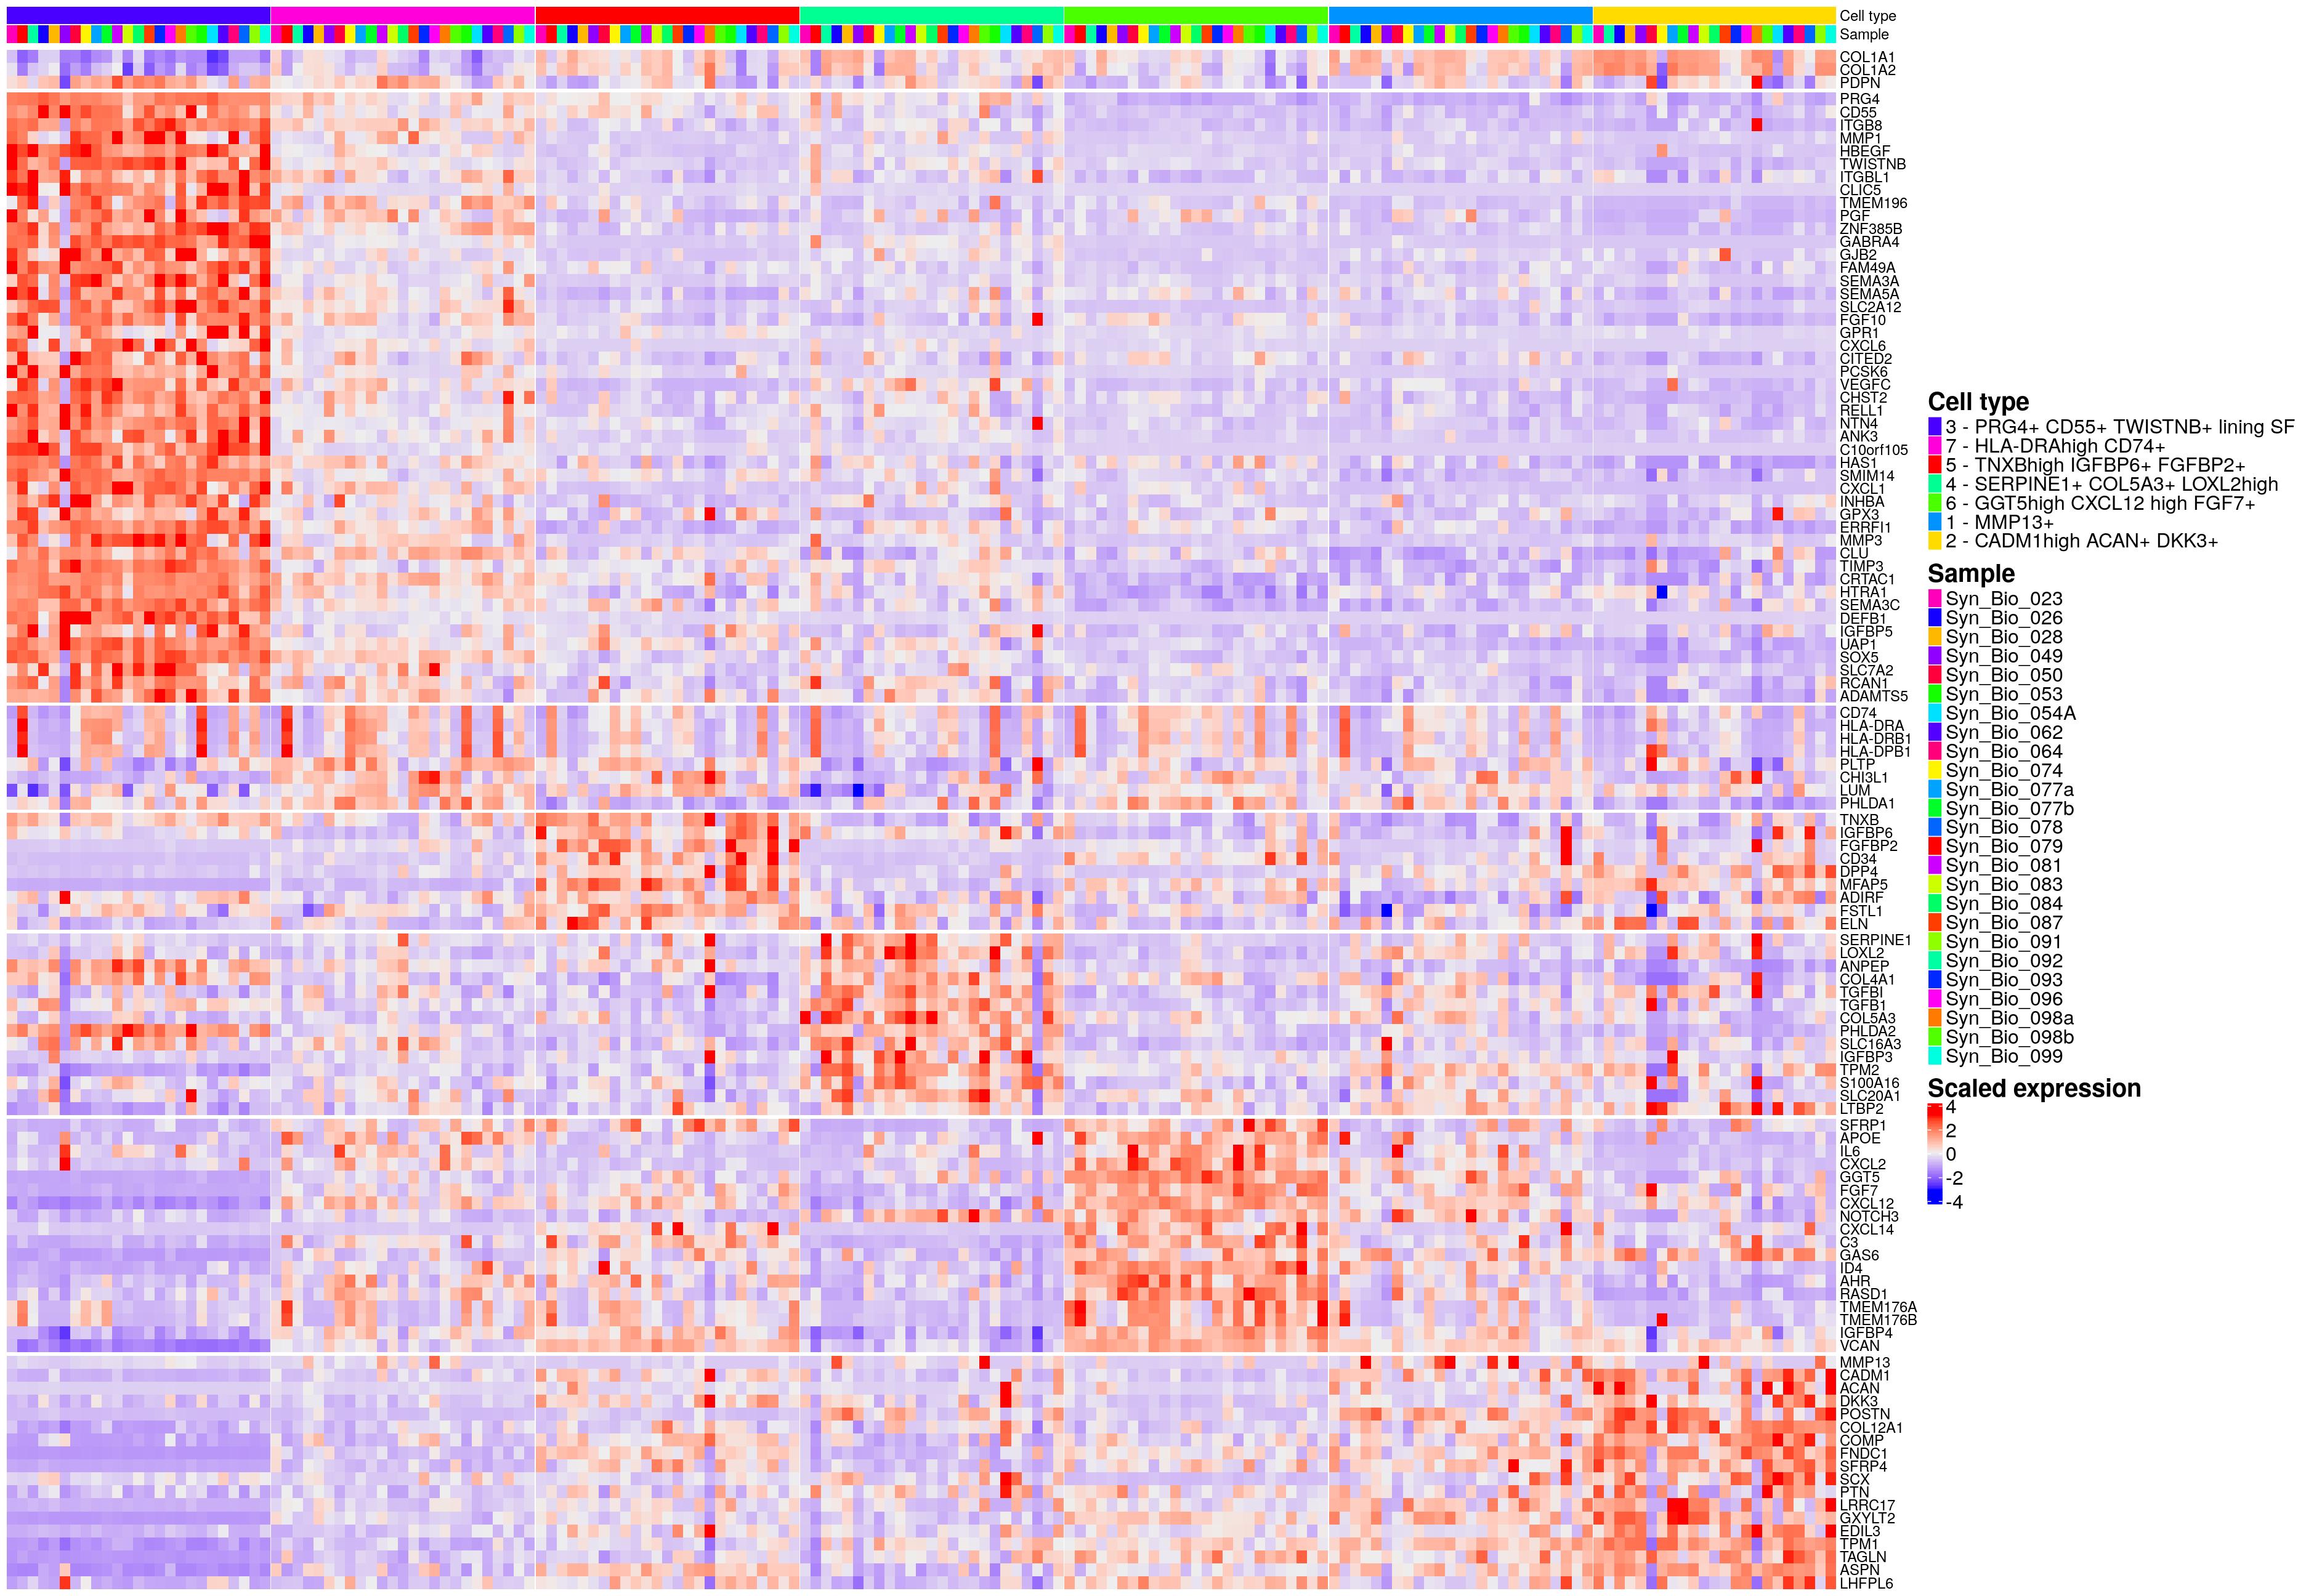
hm_ls[["sf_new"]] <- hm_ls[["sf"]]
hm_ls[["sf"]] <- tmp_figure_sf
# png(here::here("..","synovialscrnaseq","output","Figures_Paper","Suppl_Figure_9_new.png"),width=26,height=24,res = 144, units = "in")
# hm_ls[["sf_new"]]
# dev.off()findMarkers - MP
celltype_name_pre <- "mp"
# order_celltypes <- c(11,1,8,5,4,9,10,7,3,12,13,2,6)
order_celltypes <- c(9,6,5,1,4,8,2,10,3,11,12,7)
used_clustering <- "mp_clusters_k10"
# order_celltypes <- NULLtmpfilename <- paste0("syn_v",analysis_version,"_sce_",celltype_name_pre,dplyr::if_else(remove_low_quality_samples, "_invivo",""),".rds")
sce_sub <- readRDS(file = here::here("output",tmpfilename))
if(is.null(sce_sub[[paste0(celltype_name_pre,"_celltype")]])){
sce_sub[[paste0(celltype_name_pre,"_clusters_final")]] <- as.integer(sce_sub[[used_clustering]])
sce_sub[[paste0(celltype_name_pre,"_celltype")]] <- as.integer(sce_sub[[paste0(celltype_name_pre,"_clusters_final")]])
}
if(is.null(order_celltypes)){
order_celltypes <- sort(unique(sce_sub[[paste0(celltype_name_pre,"_celltype")]]))
}
format(object.size(sce_sub),units="Mb")[1] "2577 Mb"colLabels(sce_sub) <- colData(sce_sub)[[paste0(celltype_name_pre,"_celltype")]]
sce_sub_red <- sce_sub
sce_sub_red <- sce_sub_red[rowData(sce_sub_red)$is_hvg,]
colData(sce_sub_red) <- NULL
rowData(sce_sub_red) <- NULL
counts(sce_sub_red) <- NULL
assay(sce_sub_red,"reconstructed") <- NULL
metadata(sce_sub_red) <- list()
reducedDims(sce_sub_red) <- list()
colLabels(sce_sub_red) <- colData(sce_sub)[[paste0(celltype_name_pre,"_celltype")]]
as(sce_sub_red, "SingleCellExperiment")class: SingleCellExperiment
dim: 1908 35659
metadata(0):
assays(1): logcounts
rownames(1908): HES4 ISG15 ... MT-ND5 AC145212.1
rowData names(0):
colnames(35659): Syn_Bio_079.AAACCCAGTTTAGTCG
Syn_Bio_079.AAACGAAAGACATAGT ... Syn_Bio_050.TTTGGAGGTAGAATGT-1
Syn_Bio_050.TTTGTTGGTCTGTAAC-1
colData names(1): label
reducedDimNames(0):
altExpNames(0):format(object.size(sce_sub_red),units="Mb")[1] "138.2 Mb"markers <- findMarkers(sce_sub_red, test.type = "wilcox", pval.type = "all", direction="up",
lfc=0.5, block=sce_sub$Sample)
saveRDS(markers,here::here("output",paste0("findMarkers_results_v",analysis_version,"_",celltype_name_pre,".rds")))
topmarkers <- purrr::map(seq_along(markers), function(i){
  markers[[i]] %>%
  as.data.frame() %>%
  dplyr::arrange(FDR) %>%
  dplyr::select(FDR) %>%
  head(n=10)
})
names(topmarkers) <- names(markers)
topmarkers$`C1QA/B/C+ FOLR2low CCR2+ CD48+ CLEC10A`
FDR
HBEGF 1
OTUD1 1
IER3 1
TNFAIP3 1
CXCL8 1
IRF1 1
CHMP1B 1
ATF3 1
ARL4A 1
GABARAPL1 1
$`CD1C+ CLEC10A+`
FDR
CLEC10A 5.192886e-17
FCER1A 5.349127e-13
AREG 2.291077e-01
JAML 1.000000e+00
CREM 1.000000e+00
PKIB 1.000000e+00
IFITM2 1.000000e+00
CD1C 1.000000e+00
GPAT3 1.000000e+00
EZR 1.000000e+00
$`CD48+ CLEC10A+`
FDR
SORL1 1
CHMP1B 1
OLR1 1
RGS2 1
ARL4A 1
HCST 1
BTG1 1
FGL2 1
YPEL5 1
EREG 1
$`CD48high S100A12+ IL1B+`
FDR
S100A9 1.361772e-47
S100A8 6.329126e-46
VCAN 3.004319e-30
FCN1 1.785182e-12
S100A12 5.272929e-12
FCAR 3.798016e-11
FPR1 2.433728e-08
SLC2A3 1.774679e-03
SLC11A1 3.164546e-03
CD93 6.112539e-03
$`CD48low SPP1+`
FDR
FBP1 1
LDHA 1
C15orf48 1
PHLDA1 1
TIMP1 1
CD9 1
ANPEP 1
ALCAM 1
S100A10 1
IL1RN 1
$`CLEC9A+ CADM1+ CLNK+`
FDR
CPVL 6.064449e-32
CLEC9A 1.737663e-29
C1orf54 5.861233e-29
CST3 9.017387e-27
S100B 5.989549e-19
CCND1 3.324747e-18
CADM1 2.227152e-17
TACSTD2 6.216290e-16
BATF3 1.411153e-15
DNASE1L3 1.724319e-13
$`FOLR2+ MERTK+ TIMD4+ & FOLR2low MERTKlow SPP1+ subsets`
FDR
FN1 1
SLC39A8 1
MT2A 1
TGFBI 1
FABP5 1
MT1X 1
EMP1 1
SOD2 1
ATF5 1
HSPA5 1
$`FOLR2high MERTK+ SELENOPhigh CD48med`
FDR
CXCL3 1
CXCL8 1
THBD 1
CXCL2 1
ELL2 1
MMP19 1
TFRC 1
HIF1A 1
ID2 1
HMOX1 1
$`FOLR2high MERTK+ SELENOPhigh COLEC12high LYVE1+ CD209+ SLC40A1+`
FDR
SELENOP 4.533771e-55
FOLR2 5.018420e-27
PLTP 4.329616e-19
SLC40A1 5.858257e-11
DAB2 8.735748e-09
F13A1 9.683780e-09
JUN 4.050644e-07
FCGRT 2.549959e-04
EGR1 8.635116e-03
CCL3 8.353835e-01
$`FOLR2high MERTK+ SELENOPhigh COLEC12high TIMD4+`
FDR
NUPR1 9.598052e-12
IFI27 1.000000e+00
GPNMB 1.000000e+00
TXNIP 1.000000e+00
TIMD4 1.000000e+00
MT-ND5 1.000000e+00
MARCO 1.000000e+00
CTSD 1.000000e+00
KCNMA1 1.000000e+00
DST 1.000000e+00
$`FOLR2low MERTKlow TOP2A+ CENPF+ proliferating`
FDR
MKI67 6.571993e-30
CENPF 1.599883e-26
CEP55 1.807124e-26
BIRC5 3.970799e-26
STMN1 3.758186e-25
TPX2 9.172587e-21
ASPM 7.046794e-20
TOP2A 3.436303e-19
ANLN 4.578177e-19
TK1 2.384672e-18
$`IDO1+ LAMP3+`
FDR
LAMP3 1.780848e-33
CCR7 1.536981e-22
TNFAIP2 1.150758e-18
BIRC3 3.836952e-17
CD83 2.239287e-15
FSCN1 7.009093e-15
PNRC1 8.813582e-15
REL 1.257373e-12
DUSP5 6.962994e-11
MARCKSL1 1.812204e-09markergenes <- c("PTPRC","ITGAM","FCGR1A","CD14","CD63","CD68","MARCO","TREM2","RNASE1","LGMN","DAB2","APOE","CD163","FOLR2","MERTK","MRC1","CMKLR1","STAB1","PLTP","MAF","SLCO2B1","PMP22","C1QA","C1QB","C1QC","COLEC12","NUPR1","IFI27","MAMDC2","CCL18","CCL13","TIMD4","GPR34","SELENOP","NRP1","ICAM1","F13A1","EGR1","LYVE1","CD209","SLC40A1","IGF1","LYZ","CEBPD","ZNF331","RGS2","CREM","NAMPT","NR4A2","BTG1","INSIG1","IER3","VEGFA","LGALS2","AREG","CXCR4","NR4A3","CCR2","CX3CR1","GPR183","ARL4C","CLEC10A","SPP1","EREG","IL1RN","PPIF","FCN1","CD52","ITGAX","CD300E","FCAR","APOBEC3A","SLC11A1","FPR2","S100A9","S100A8","S100A12","PLAC8","SELL","CD93","CSF3R","CD48","IL1B","RILPL2","SAMSN1","SLC7A5","CLEC4A","THBS1","CSTA","G0S2","CD1C","FCER1A","LAMP3","CD83","IDO1","CLEC9A","CLNK","CADM1","IRF8")
column <- paste0(celltype_name_pre,"_clusters_final")
column_labels <- paste0(celltype_name_pre,"_celltype")
sce_sub[[column]] <- factor(sce_sub[[column]],levels = order_celltypes)
dic <- unique(as.data.frame(colData(sce_sub)[,c(column,column_labels)])) %>%
dplyr::arrange(!!dplyr::sym(column))
# subcelltype_colors <- viridis::viridis(length(dic[[column]]))
subcelltype_colors <- rainbow(length(dic[[column]]))[order(as.character(dic[[column]]))]
names(subcelltype_colors) <- dic[[column]]
tmp <- subcelltype_colors[names(subcelltype_colors)=="1"]
subcelltype_colors[names(subcelltype_colors)=="1"] <- subcelltype_colors[names(subcelltype_colors)=="7"]
subcelltype_colors[names(subcelltype_colors)=="7"] <- tmp
tmp <- subcelltype_colors[names(subcelltype_colors)=="3"]
subcelltype_colors[names(subcelltype_colors)=="3"] <- subcelltype_colors[names(subcelltype_colors)=="10"]
subcelltype_colors[names(subcelltype_colors)=="10"] <- tmp
column_names <- paste0(dic[[column]], " - ",dic[[column_labels]])
dic$colors <- subcelltype_colors
dic$column_names <- column_names
clusters <- sce_sub[[paste0(celltype_name_pre,"_clusters_final")]]
clucol <- dic$colors
names(clucol) <- dic$column_names
samples <- sce_sub$Sample
samcol <- sample_cols(unique(samples))
names(samcol) <- unique(samples)
diagnosis <- sce_sub$Diagnosis_main
diagcol <- get_colors("diagnosis")
diagcol <- diagcol[names(diagcol) %in% unique(sce_sub$Diagnosis_main)]
clusters_samples <- paste0(clusters,"-",diagnosis,"-", samples)mataggr <- summarizeAssayByGroup(logcounts(sce_sub),clusters_samples, subset.row=markergenes)
# order
tmpcoldat <- colData(sce_sub) %>%
as.data.frame() %>%
dplyr::mutate(tmp_clusters_final=!!dplyr::sym(paste0(celltype_name_pre,"_clusters_final"))) %>%
dplyr::left_join(data.frame(tmp_clusters_final=factor(order_celltypes),
tmp_celltype_order=seq_along(unique(sce_sub[[paste0(celltype_name_pre,"_clusters_final")]]))),
by="tmp_clusters_final") %>%
dplyr::arrange(tmp_celltype_order, Diagnosis_main, Sample)
order_samples <- tmpcoldat %>%
dplyr::select(tmp_clusters_final, Diagnosis_main, Sample) %>%
unique() %>%
dplyr::mutate(tmpname=paste0(stringr::str_replace_all(tmp_clusters_final,"/","\n"),"-",Diagnosis_main,"-", Sample)) %>%
dplyr::pull()
mataggr <- mataggr[,order_samples]
colnamessplit <- stringr::str_split(colnames(mataggr),"-")
clustersaggr <- purrr::map_chr(colnamessplit,~.x[1])
diagcolsaggr <- purrr::map_chr(colnamessplit,~.x[2])
samplesaggr <- purrr::map_chr(colnamessplit,~.x[3])
tmpass <- t(apply(assay(mataggr,"mean"),1,scale))
colnames(tmpass) <- colnames(assay(mataggr,"mean"))
assay(mataggr,"mean_scale") <- tmpass
library(ComplexHeatmap)
ht_opt$TITLE_PADDING = unit(c(4, 20), "points")
tmpct <- factor(clustersaggr,levels = unique(clustersaggr),labels = paste0(unique(clustersaggr)," - ",purrr::map_chr(unique(clustersaggr),~dic$mp_celltype[dic$mp_clusters_final==.x])))
cluolord <- purrr::map_int(seq_along(levels(tmpct)),~ which(levels(tmpct)[.x] == names(clucol)))
clucol <- clucol[cluolord]
ha <- ComplexHeatmap::HeatmapAnnotation(show_legend = c(FALSE, TRUE, TRUE),
`Cell type` = tmpct,
# Diagnosis=diagcolsaggr,
Sample = samplesaggr,
col=list(`Cell type`=clucol,Sample=samcol,Diagnosis=diagcol),
annotation_legend_param=list(labels_gp = gpar(fontsize=16),
title_gp = gpar(fontsize=20,fontface="bold")))
hm <- ComplexHeatmap::Heatmap(
assay(mataggr,"mean_scale"),
heatmap_legend_param = list(title = "Scaled expression",fontsize=20,gap=unit(20, "mm"),
labels_gp = gpar(fontsize=16),
title_gp = gpar(fontsize=20,fontface="bold")), cluster_rows = FALSE,
cluster_columns=FALSE,
column_order=order_samples,
show_column_names=FALSE,
column_split=factor(clustersaggr,levels = unique(clustersaggr)),
column_gap = unit(0.2, "mm"),
column_title = NULL
)
hm_ls[[celltype_name_pre]] <- ha %v% hm
lgd_list <- list(
Legend(at = levels(tmpct), title = "\nCell type",
legend_gp = gpar(fill = clucol),
labels_gp = gpar(fontsize=16),
title_gp = gpar(fontsize=20,fontface="bold"))
)
# lgd_list <- list(
# Legend(at = levels(tmpct)[1], title = "\nCell type",
# legend_gp = gpar(fill = clucol[1]),
# labels_gp = gpar(fontsize=16),
# title_gp = gpar(fontsize=20,fontface="bold")),
# Legend(at = levels(tmpct)[2:6], title = "FOL2R+ MERTK+ CD206+ macrophages",
# legend_gp = gpar(fill = clucol[2:6]),
# labels_gp = gpar(fontsize=16),
# title_gp = gpar(fontsize=18,fontface="bold")),
# Legend(at = levels(tmpct)[7:9], title = "CCR2+ macrophages",
# legend_gp = gpar(fill = clucol[7:9]),
# labels_gp = gpar(fontsize=16),
# title_gp = gpar(fontsize=18,fontface="bold")),
# Legend(at = levels(tmpct)[10:13], title = "Dendritic cells (DSs)",
# legend_gp = gpar(fill = clucol[10:13]),
# labels_gp = gpar(fontsize=16),
# title_gp = gpar(fontsize=18,fontface="bold"))
# )
hm_ls[[paste0(celltype_name_pre,"_draw")]] <- draw(hm_ls[[celltype_name_pre]], ht_gap = unit(0, "mm"), merge_legends=TRUE, annotation_legend_list = lgd_list,align_annotation_legend="heatmap_center")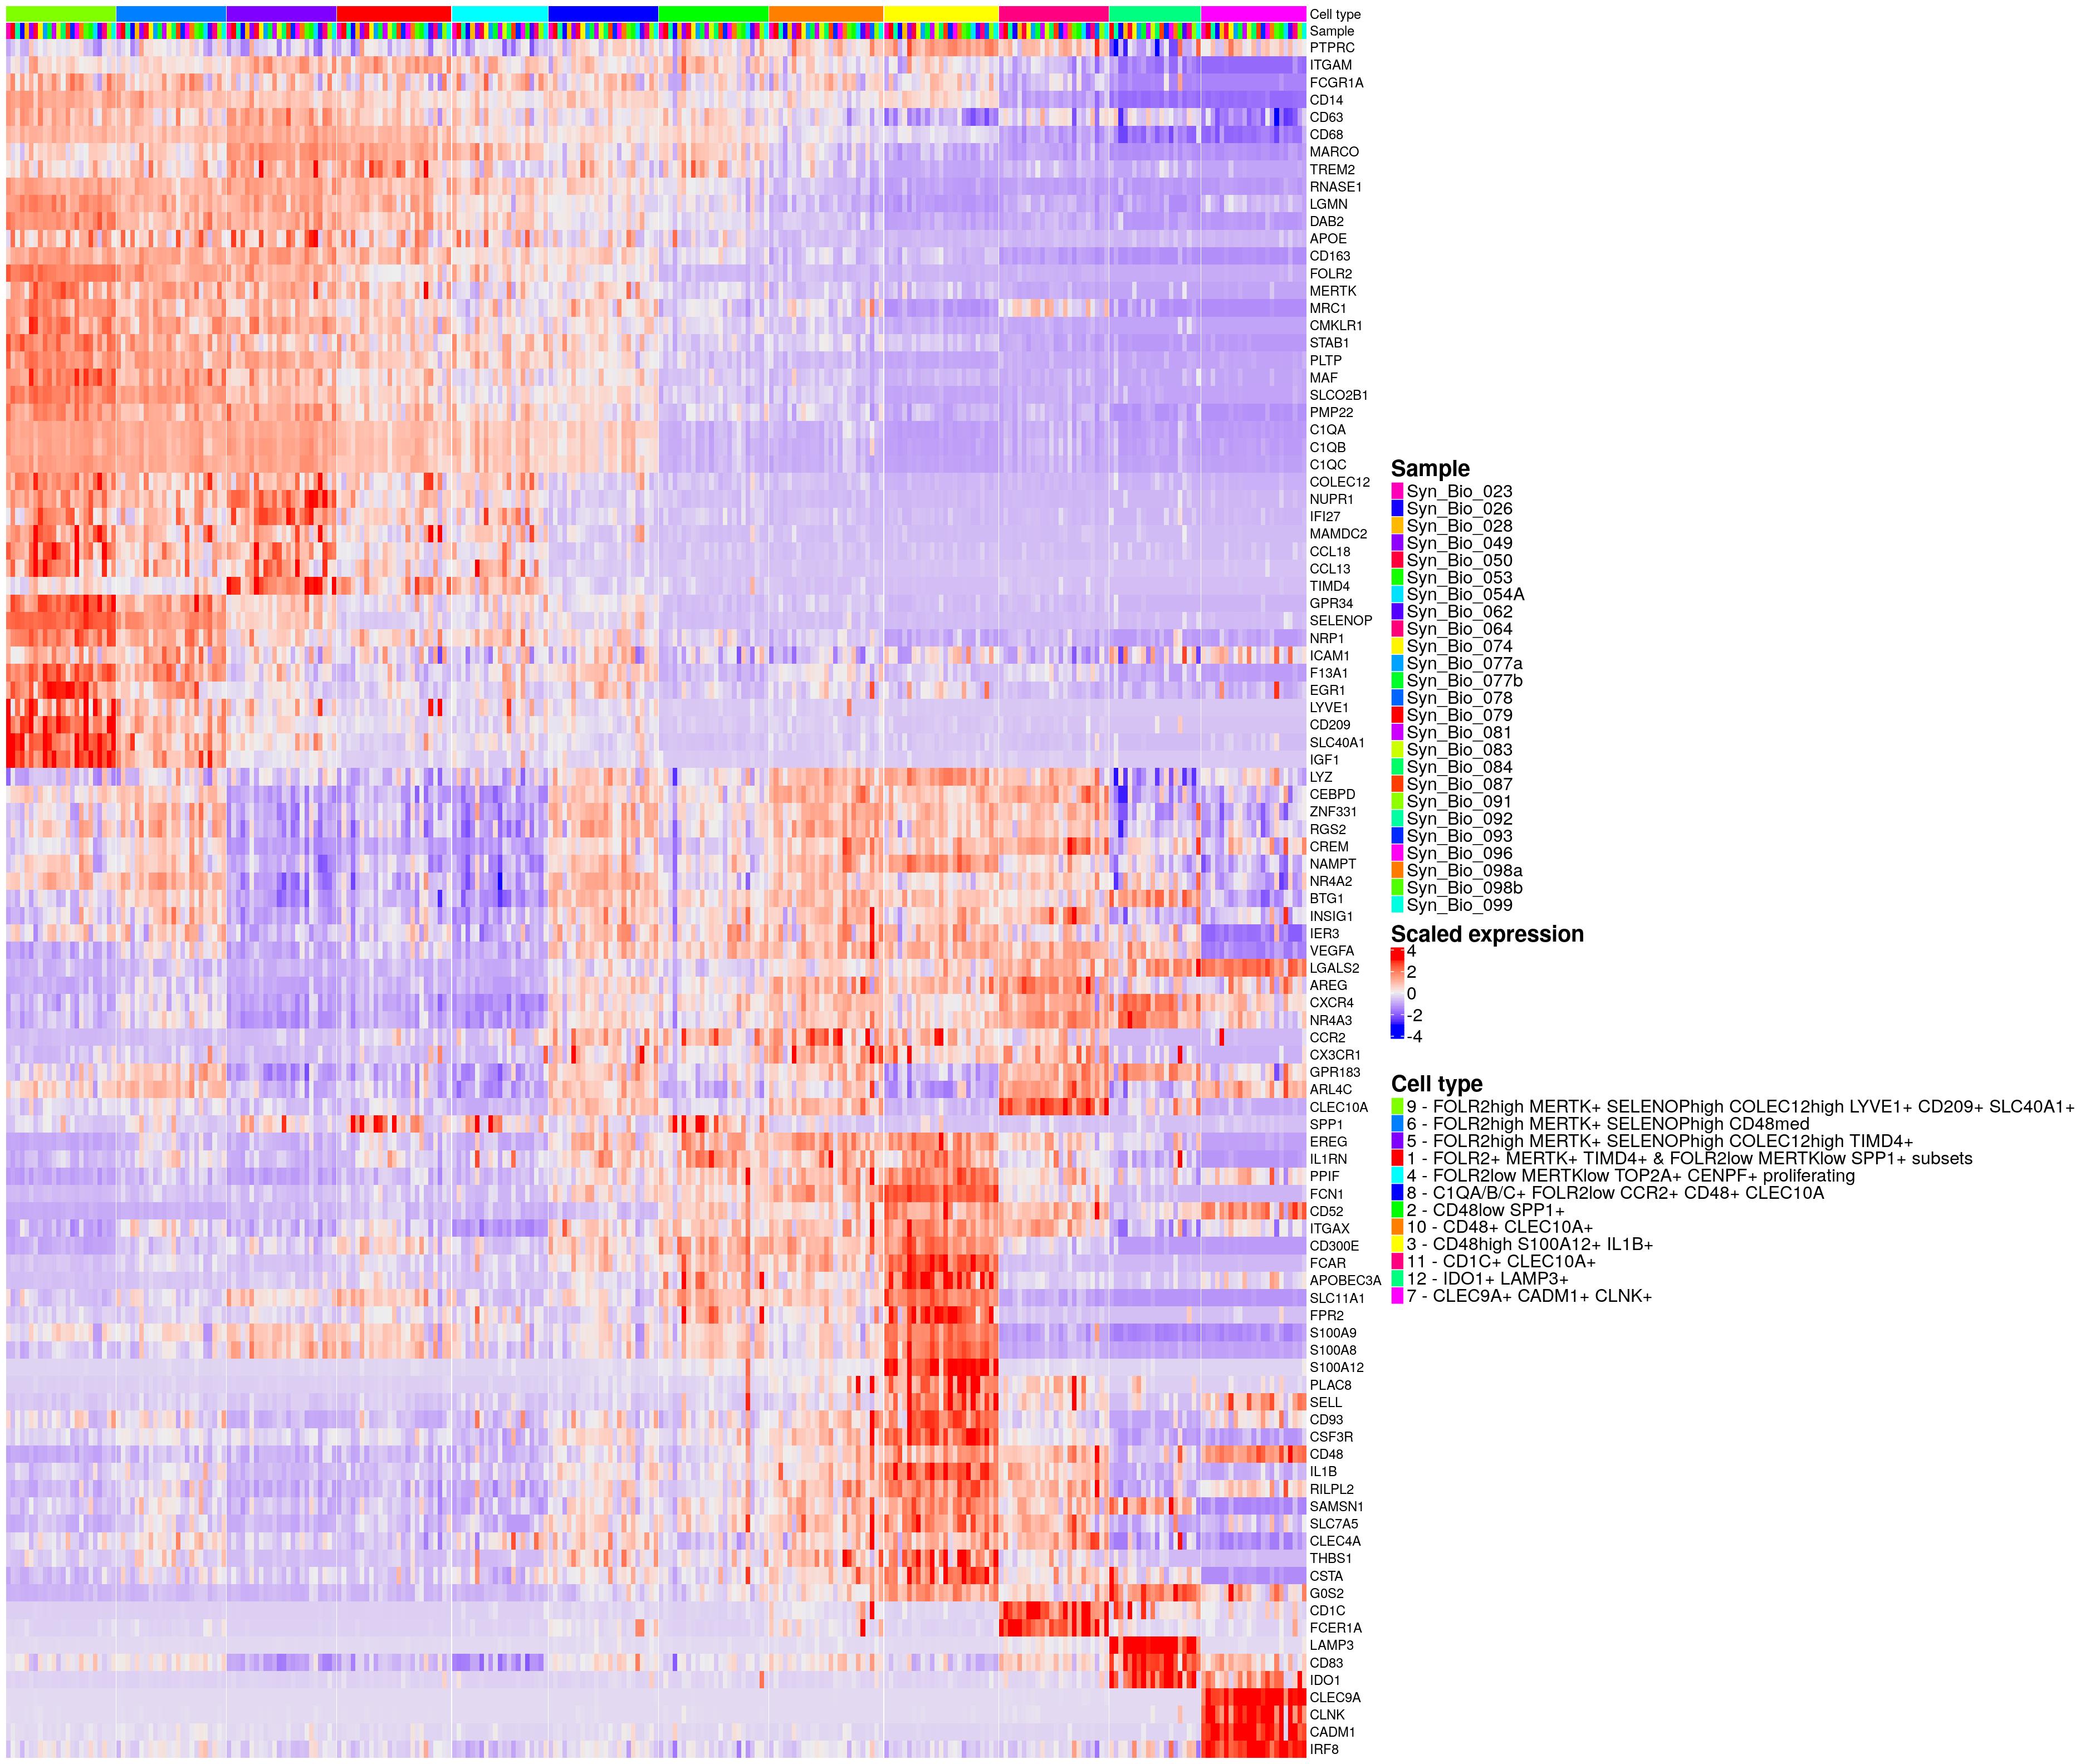
findMarkers - TC
celltype_name_pre <- "tc"
order_celltypes <- c(4,5,1,6,7,8,2,3,9)
used_clustering <- "tc_clusters_final"
# order_celltypes <- NULLtmpfilename <- paste0("syn_v",analysis_version,"_sce_",celltype_name_pre,dplyr::if_else(remove_low_quality_samples, "_invivo",""),".rds")
sce_sub <- readRDS(file = here::here("output",tmpfilename))
if(is.null(sce_sub[[paste0(celltype_name_pre,"_celltype")]])){
sce_sub[[paste0(celltype_name_pre,"_clusters_final")]] <- as.integer(sce_sub[[used_clustering]])
sce_sub[[paste0(celltype_name_pre,"_celltype")]] <- as.integer(sce_sub[[paste0(celltype_name_pre,"_clusters_final")]])
}
if(is.null(order_celltypes)){
order_celltypes <- sort(unique(sce_sub[[paste0(celltype_name_pre,"_celltype")]]))
}
format(object.size(sce_sub),units="Mb")[1] "931.7 Mb"colLabels(sce_sub) <- colData(sce_sub)[[paste0(celltype_name_pre,"_celltype")]]
sce_sub_red <- sce_sub
sce_sub_red <- sce_sub_red[rowData(sce_sub_red)$is_hvg,]
colData(sce_sub_red) <- NULL
rowData(sce_sub_red) <- NULL
counts(sce_sub_red) <- NULL
assay(sce_sub_red,"reconstructed") <- NULL
metadata(sce_sub_red) <- list()
reducedDims(sce_sub_red) <- list()
colLabels(sce_sub_red) <- colData(sce_sub)[[paste0(celltype_name_pre,"_celltype")]]
as(sce_sub_red, "SingleCellExperiment")class: SingleCellExperiment
dim: 2814 23169
metadata(0):
assays(1): logcounts
rownames(2814): PERM1 HES4 ... MT-TL2 AL354822.1
rowData names(0):
colnames(23169): Syn_Bio_079.AAACCCATCCTGGTCT
Syn_Bio_079.AAACCCATCGAACCAT ... Syn_Bio_050.TTTGGTTTCACATTGG-1
Syn_Bio_050.TTTGTTGTCGCCCAGA-1
colData names(1): label
reducedDimNames(0):
altExpNames(0):format(object.size(sce_sub_red),units="Mb")[1] "47.3 Mb"markers <- findMarkers(sce_sub_red, test.type = "wilcox", pval.type = "all", direction="up",
lfc=0.5, block=sce_sub$Sample)
saveRDS(markers,here::here("output",paste0("findMarkers_results_v",analysis_version,"_",celltype_name_pre,".rds")))
topmarkers <- purrr::map(seq_along(markers), function(i){
markers[[i]] %>%
as.data.frame() %>%
dplyr::arrange(FDR) %>%
dplyr::select(FDR) %>%
head(n=10)
})
names(topmarkers) <- names(markers)
topmarkers$`CCR7high LEF1+ SELL+`
FDR
RPS8 3.241573e-09
RPL21 1.346744e-04
RPS6 9.389380e-03
RPS13 2.518856e-02
RPL23 2.519568e-02
RPS3A 1.383866e-01
RPL13 1.795839e-01
EEF1B2 1.795839e-01
RPS18 2.208074e-01
RPS12 4.694525e-01
$`CCR7med LEF1low SELLlow`
FDR
RGCC 1
ANXA1 1
KLF6 1
FOS 1
TSC22D3 1
DUSP1 1
TNFAIP3 1
LMNA 1
MCL1 1
PPP1R15A 1
$`CD3- NKG7- KLRB1+ IL7R+`
FDR
FOSB 1
KLRB1 1
NFKBIA 1
AREG 1
JUND 1
TNFRSF18 1
TIMP1 1
BTG2 1
XCL1 1
LMNA 1
$`CD3- NKG7+ GNLY+`
FDR
GNLY 1
TYROBP 1
FCER1G 1
GZMB 1
CD7 1
KLRD1 1
IER2 1
REL 1
PRF1 1
IFITM2 1
$`GZMB- GZMH- GZMK+`
FDR
DUSP2 1
TUBA4A 1
PIK3R1 1
NR4A2 1
CXCR4 1
CREM 1
RGS1 1
GZMM 1
RUNX3 1
GZMK 1
$`GZMB+ GZMH+ GZMK- GNLY+`
FDR
GZMH 1
CD52 1
RUNX3 1
LGALS1 1
ID2 1
ARL4C 1
LITAF 1
CST7 1
SYNE2 1
METRNL 1
$`GZMB+ GZMH+ GZMK+`
FDR
GZMA 1
CCL4 1
CD8A 1
CCL5 1
HLA-DPB1 1
CD74 1
HLA-DPA1 1
CLEC2B 1
HCST 1
HLA-DRB1 1
$`TIGIT+ CTLA4+`
FDR
MAF 8.773069e-10
IL32 1.000000e+00
DUSP4 1.000000e+00
ARID5B 1.000000e+00
CTLA4 1.000000e+00
CD2 1.000000e+00
NR3C1 1.000000e+00
RBPJ 1.000000e+00
S100A4 1.000000e+00
TNFRSF4 1.000000e+00
$`TOP2A+ CENPF+`
FDR
HMGB2 1.380647e-35
MKI67 1.380647e-35
STMN1 3.582537e-33
TOP2A 2.201522e-31
TUBA1B 4.271050e-31
CENPF 7.993601e-31
TUBB 3.977797e-29
HIST1H4C 5.383778e-25
HIST1H1B 1.749932e-23
H2AFZ 4.214657e-23column <- paste0(celltype_name_pre,"_clusters_final")
column_labels <- paste0(celltype_name_pre,"_celltype")
sce_sub[[column]] <- factor(sce_sub[[column]],levels = order_celltypes)
dic <- unique(as.data.frame(colData(sce_sub)[,c(column,column_labels)])) %>%
dplyr::arrange(!!dplyr::sym(column))
# subcelltype_colors <- viridis::viridis(length(dic[[column]]))
subcelltype_colors <- rainbow(length(dic[[column]]))[order(as.character(dic[[column]]))]
names(subcelltype_colors) <- dic[[column]]
column_names <- paste0(dic[[column]], " - ",dic[[column_labels]])
dic$colors <- subcelltype_colors
dic$column_names <- column_names
markergenes_ls <-
list(`1`=c("PTPRC","CD3D","CD3E","CD3G","CD4","TIGIT","PDCD1","CXCL13","CTLA4","FOXP3","CCR7","LEF1","SELL","NKG7","GZMA","GZMM","CCL5","CD8A","CD8B","GZMK","GZMB","GZMH","GNLY","KLRD1","KLRC1","KLRF1","KLRB1", "IL7R")
)
markergenes_n <- purrr::map(markergenes_ls, ~length(.x))
markergenes <- unlist(markergenes_ls)clusters <- sce_sub[[paste0(celltype_name_pre,"_clusters_final")]]
clucol <- dic$colors
names(clucol) <- dic$column_names
samples <- sce_sub$Sample
samcol <- sample_cols(unique(samples))
names(samcol) <- unique(samples)
diagnosis <- sce_sub$Diagnosis_main
diagcol <- get_colors("diagnosis")
diagcol <- diagcol[names(diagcol) %in% unique(sce_sub$Diagnosis_main)]
clusters_samples <- paste0(clusters,"-",diagnosis,"-", samples)
mataggr <- summarizeAssayByGroup(logcounts(sce_sub),clusters_samples, subset.row=markergenes)
tmpcoldat <- colData(sce_sub) %>%
as.data.frame() %>%
dplyr::mutate(tmp_clusters_final=!!dplyr::sym(paste0(celltype_name_pre,"_clusters_final"))) %>%
dplyr::left_join(data.frame(tmp_clusters_final=factor(order_celltypes),
tmp_celltype_order=seq_along(unique(sce_sub[[paste0(celltype_name_pre,"_clusters_final")]]))),
by="tmp_clusters_final") %>%
dplyr::arrange(tmp_celltype_order, Diagnosis_main, Sample)
order_samples <- tmpcoldat %>%
dplyr::select(tmp_clusters_final, Diagnosis_main, Sample) %>%
unique() %>%
dplyr::mutate(tmpname=paste0(stringr::str_replace_all(tmp_clusters_final,"/","\n"),"-",Diagnosis_main,"-", Sample)) %>%
dplyr::pull()
mataggr <- mataggr[,order_samples]
colnamessplit <- stringr::str_split(colnames(mataggr),"-")
clustersaggr <- purrr::map_chr(colnamessplit,~.x[1])
diagcolsaggr <- purrr::map_chr(colnamessplit,~.x[2])
samplesaggr <- purrr::map_chr(colnamessplit,~.x[3])
tmpass <- t(apply(assay(mataggr,"mean"),1,scale))
colnames(tmpass) <- colnames(assay(mataggr,"mean"))
assay(mataggr,"mean_scale") <- tmpass
order_samples <- colnames(mataggr)[order(colnames(mataggr))]
library(ComplexHeatmap)
ha <- ComplexHeatmap::HeatmapAnnotation(
    `Cell type` = factor(
      clustersaggr,
      levels = unique(clustersaggr),
      labels = paste0(unique(clustersaggr)," - ",purrr::map_chr(unique(clustersaggr),                                                        ~dic[[paste0(celltype_name_pre,"_celltype")]][dic[[paste0(celltype_name_pre,"_clusters_final")]] == .x]))),
    # Diagnosis=diagcolsaggr,
    Sample = samplesaggr,
    col=list(`Cell type`=clucol,Sample=samcol,Diagnosis=diagcol),
    annotation_legend_param=list(labels_gp = gpar(fontsize=16),
                                 title_gp = gpar(fontsize=20,fontface="bold")))


ht_opt$TITLE_PADDING = unit(c(4, 20), "points")
ht <- ComplexHeatmap::Heatmap(
  assay(mataggr,"mean_scale"),
  heatmap_legend_param = list(title = "Scaled expression",fontsize=20,gap=unit(20, "mm"),
                              labels_gp = gpar(fontsize=16),
                              title_gp = gpar(fontsize=20,fontface="bold")),
  cluster_rows = FALSE,
  cluster_columns=FALSE,
  column_order=order_samples,
  show_column_names=FALSE,
  column_split=factor(clustersaggr,levels = unique(clustersaggr)),
  column_title = NULL,
  column_gap = unit(0.2, "mm"),
  row_split=factor(unlist(purrr::map(seq_along(markergenes_n),~rep(names(markergenes_n)[.x],markergenes_n[[.x]]))),
                   levels = unique(clustersaggr)),
  row_title = NULL
)
hm_ls[[celltype_name_pre]] <- ha %v% ht

hm_ls[[celltype_name_pre]] 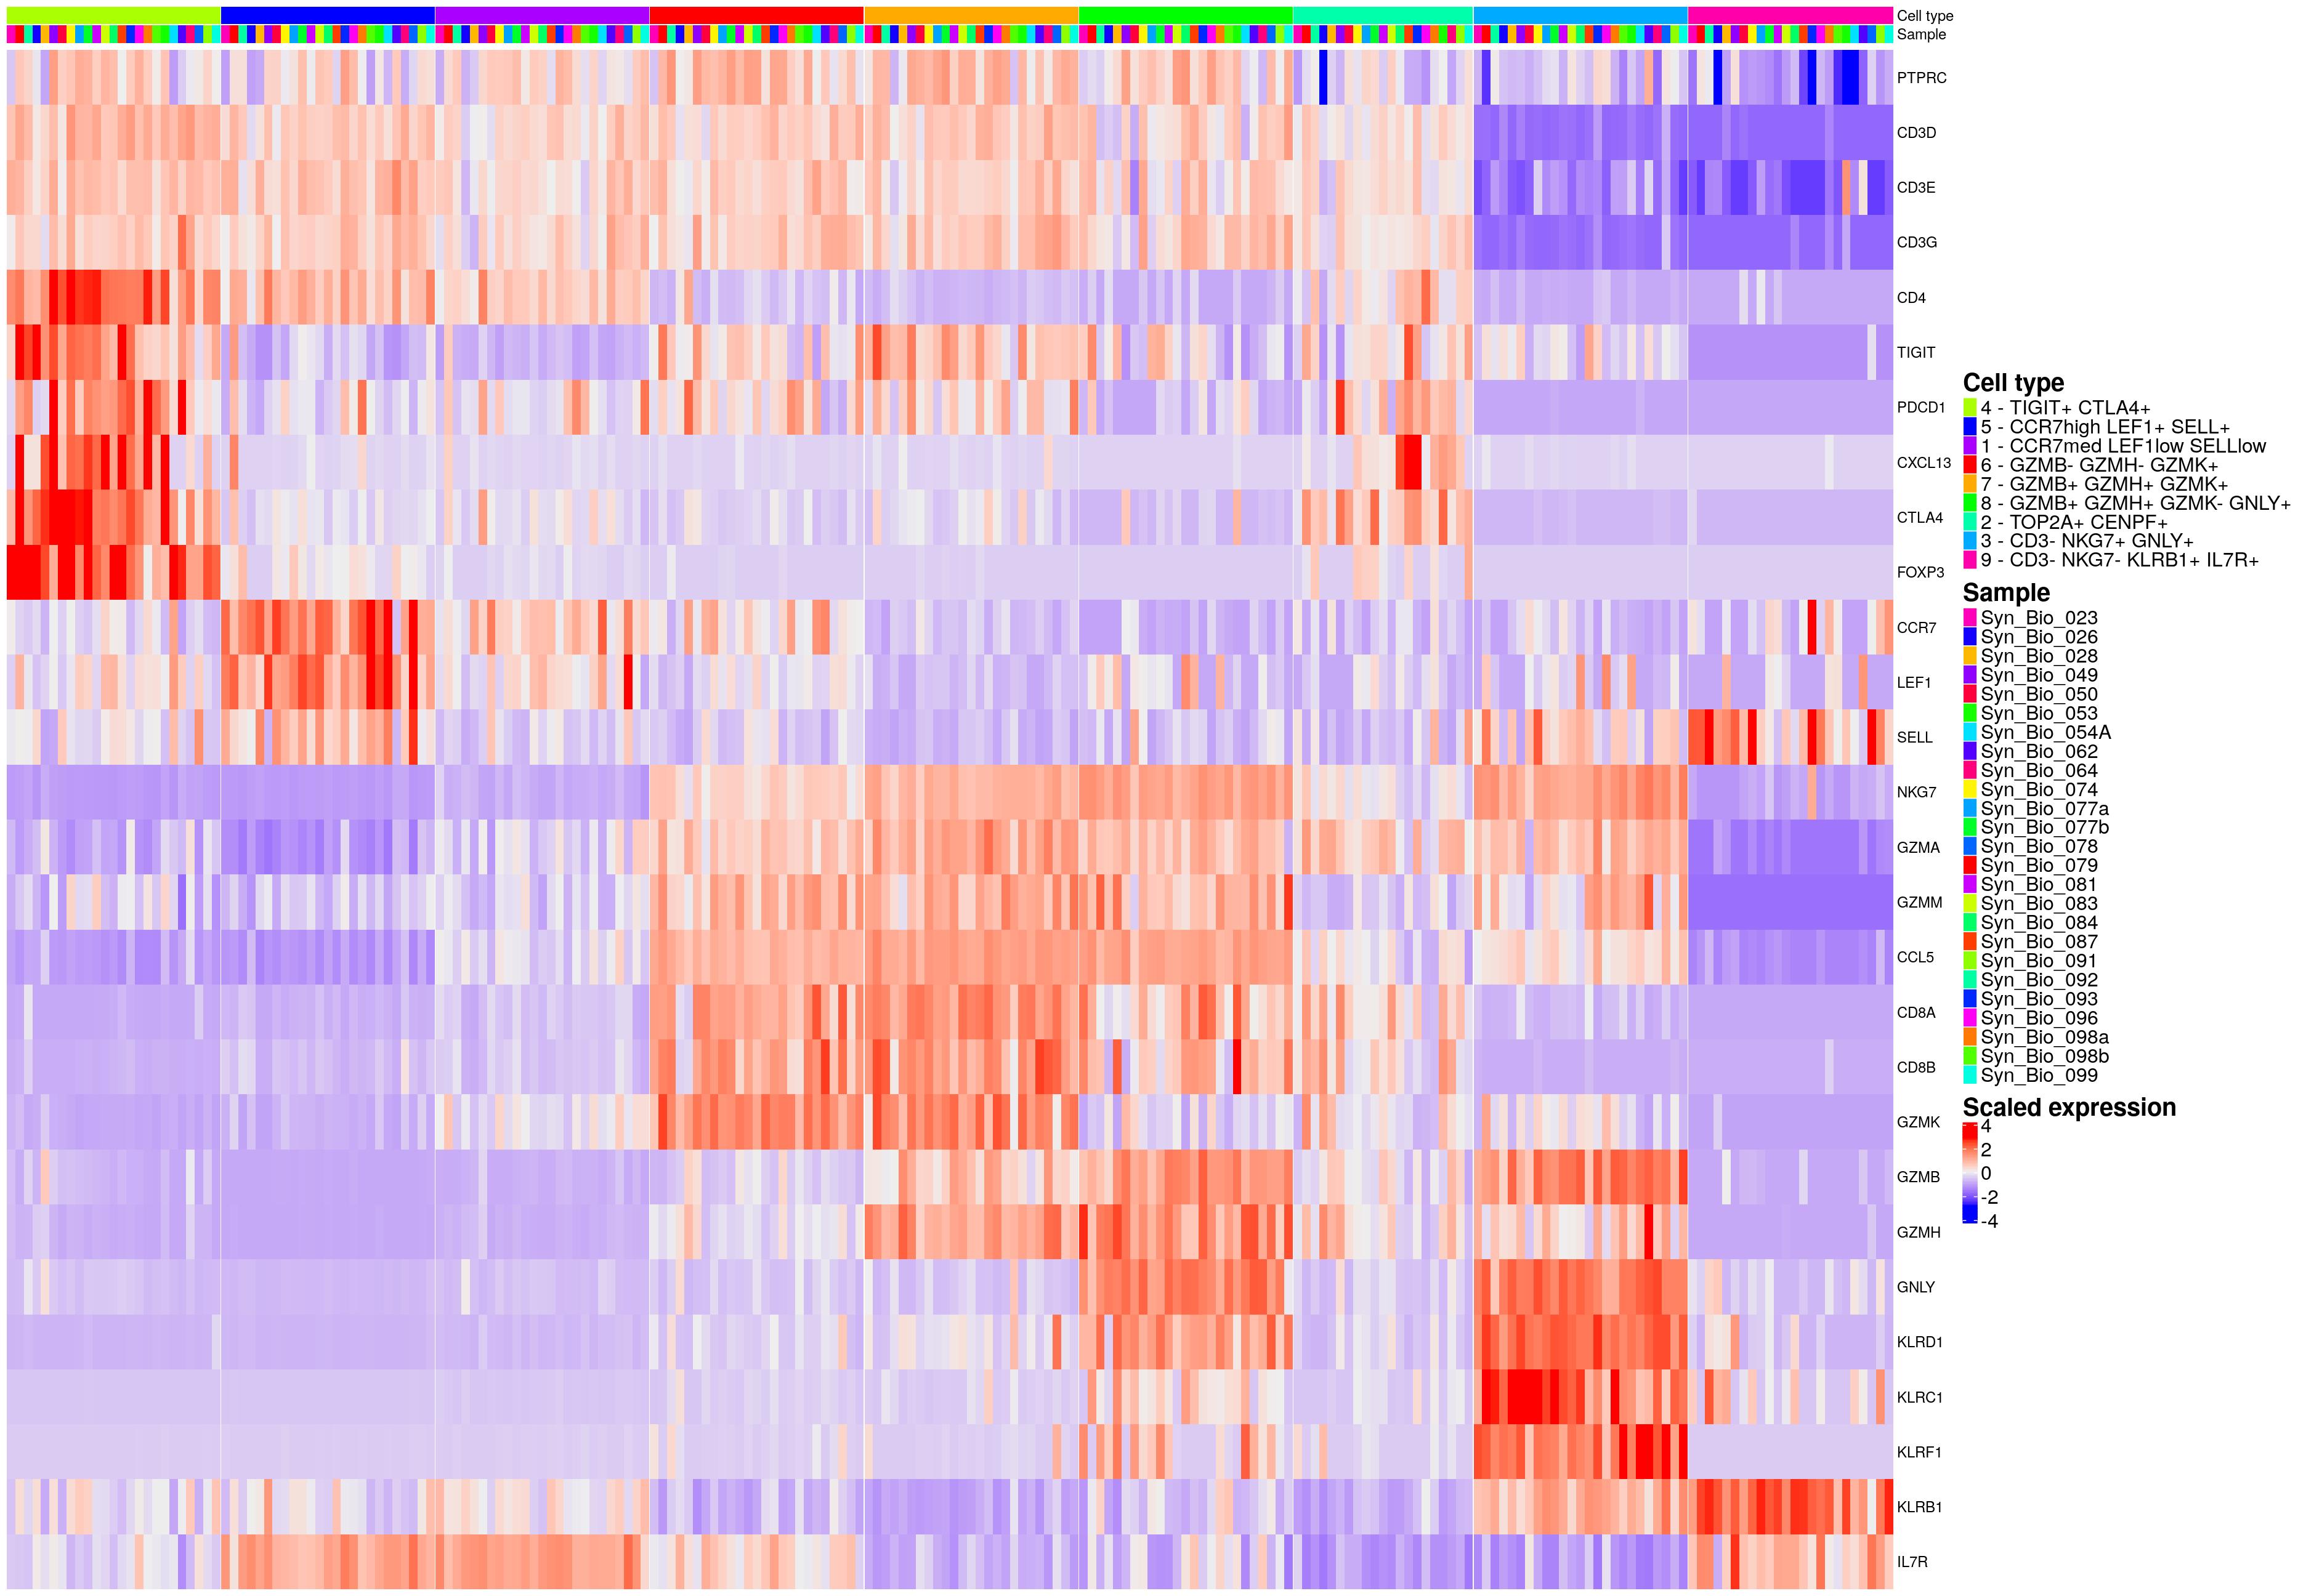
hm_ls[["tc_new"]] <- hm_ls[["tc"]]
saveRDS(hm_ls[["tc_new"]],here::here("..","synovialscrnaseq","output","Suppl_Figure_4d.rds"))
png(here::here("..","synovialscrnaseq","output","Figures_Paper","Suppl_Figure_11_new.png"),width=26,height=18,res = 144, units = "in")
hm_ls[["tc_new"]]
dev.off()
pdf
2 celltype_name_pre <- "tc"
order_celltypes <- c(4,5,1,6,7,8,2,3,9)
used_clustering <- "tc_clusters_final"
# order_celltypes <- NULLtmpfilename <- paste0("syn_v",analysis_version,"_sce_",celltype_name_pre,dplyr::if_else(remove_low_quality_samples, "_invivo",""),".rds")
sce_sub <- readRDS(file = here::here("output",tmpfilename))
if(is.null(sce_sub[[paste0(celltype_name_pre,"_celltype")]])){
sce_sub[[paste0(celltype_name_pre,"_clusters_final")]] <- as.integer(sce_sub[[used_clustering]])
sce_sub[[paste0(celltype_name_pre,"_celltype")]] <- as.integer(sce_sub[[paste0(celltype_name_pre,"_clusters_final")]])
}
if(is.null(order_celltypes)){
order_celltypes <- sort(unique(sce_sub[[paste0(celltype_name_pre,"_celltype")]]))
}
format(object.size(sce_sub),units="Mb")[1] "931.7 Mb"colLabels(sce_sub) <- colData(sce_sub)[[paste0(celltype_name_pre,"_celltype")]]
sce_sub_red <- sce_sub
sce_sub_red <- sce_sub_red[rowData(sce_sub_red)$is_hvg,]
colData(sce_sub_red) <- NULL
rowData(sce_sub_red) <- NULL
counts(sce_sub_red) <- NULL
assay(sce_sub_red,"reconstructed") <- NULL
metadata(sce_sub_red) <- list()
reducedDims(sce_sub_red) <- list()
colLabels(sce_sub_red) <- colData(sce_sub)[[paste0(celltype_name_pre,"_celltype")]]
as(sce_sub_red, "SingleCellExperiment")class: SingleCellExperiment
dim: 2814 23169
metadata(0):
assays(1): logcounts
rownames(2814): PERM1 HES4 ... MT-TL2 AL354822.1
rowData names(0):
colnames(23169): Syn_Bio_079.AAACCCATCCTGGTCT
Syn_Bio_079.AAACCCATCGAACCAT ... Syn_Bio_050.TTTGGTTTCACATTGG-1
Syn_Bio_050.TTTGTTGTCGCCCAGA-1
colData names(1): label
reducedDimNames(0):
altExpNames(0):format(object.size(sce_sub_red),units="Mb")[1] "47.3 Mb"markers <- findMarkers(sce_sub_red, test.type = "wilcox", pval.type = "all", direction="up",
lfc=0.5, block=sce_sub$Sample)
saveRDS(markers,here::here("output",paste0("findMarkers_results_v",analysis_version,"_",celltype_name_pre,".rds")))
topmarkers <- purrr::map(seq_along(markers), function(i){
markers[[i]] %>%
as.data.frame() %>%
dplyr::arrange(FDR) %>%
dplyr::select(FDR) %>%
head(n=10)
})
names(topmarkers) <- names(markers)
topmarkers$`CCR7high LEF1+ SELL+`
FDR
RPS8 3.241573e-09
RPL21 1.346744e-04
RPS6 9.389380e-03
RPS13 2.518856e-02
RPL23 2.519568e-02
RPS3A 1.383866e-01
RPL13 1.795839e-01
EEF1B2 1.795839e-01
RPS18 2.208074e-01
RPS12 4.694525e-01
$`CCR7med LEF1low SELLlow`
FDR
RGCC 1
ANXA1 1
KLF6 1
FOS 1
TSC22D3 1
DUSP1 1
TNFAIP3 1
LMNA 1
MCL1 1
PPP1R15A 1
$`CD3- NKG7- KLRB1+ IL7R+`
FDR
FOSB 1
KLRB1 1
NFKBIA 1
AREG 1
JUND 1
TNFRSF18 1
TIMP1 1
BTG2 1
XCL1 1
LMNA 1
$`CD3- NKG7+ GNLY+`
FDR
GNLY 1
TYROBP 1
FCER1G 1
GZMB 1
CD7 1
KLRD1 1
IER2 1
REL 1
PRF1 1
IFITM2 1
$`GZMB- GZMH- GZMK+`
FDR
DUSP2 1
TUBA4A 1
PIK3R1 1
NR4A2 1
CXCR4 1
CREM 1
RGS1 1
GZMM 1
RUNX3 1
GZMK 1
$`GZMB+ GZMH+ GZMK- GNLY+`
FDR
GZMH 1
CD52 1
RUNX3 1
LGALS1 1
ID2 1
ARL4C 1
LITAF 1
CST7 1
SYNE2 1
METRNL 1
$`GZMB+ GZMH+ GZMK+`
FDR
GZMA 1
CCL4 1
CD8A 1
CCL5 1
HLA-DPB1 1
CD74 1
HLA-DPA1 1
CLEC2B 1
HCST 1
HLA-DRB1 1
$`TIGIT+ CTLA4+`
FDR
MAF 8.773069e-10
IL32 1.000000e+00
DUSP4 1.000000e+00
ARID5B 1.000000e+00
CTLA4 1.000000e+00
CD2 1.000000e+00
NR3C1 1.000000e+00
RBPJ 1.000000e+00
S100A4 1.000000e+00
TNFRSF4 1.000000e+00
$`TOP2A+ CENPF+`
FDR
HMGB2 1.380647e-35
MKI67 1.380647e-35
STMN1 3.582537e-33
TOP2A 2.201522e-31
TUBA1B 4.271050e-31
CENPF 7.993601e-31
TUBB 3.977797e-29
HIST1H4C 5.383778e-25
HIST1H1B 1.749932e-23
H2AFZ 4.214657e-23column <- paste0(celltype_name_pre,"_clusters_final")
column_labels <- paste0(celltype_name_pre,"_celltype")
sce_sub[[column]] <- factor(sce_sub[[column]],levels = order_celltypes)
dic <- unique(as.data.frame(colData(sce_sub)[,c(column,column_labels)])) %>%
dplyr::arrange(!!dplyr::sym(column))
# subcelltype_colors <- viridis::viridis(length(dic[[column]]))
subcelltype_colors <- rainbow(length(dic[[column]]))[order(as.character(dic[[column]]))]
names(subcelltype_colors) <- dic[[column]]
column_names <- paste0(dic[[column]], " - ",dic[[column_labels]])
dic$colors <- subcelltype_colors
dic$column_names <- column_names
markergenes_ls <- purrr::map(topmarkers[dic[[paste0(celltype_name_pre,"_celltype")]]],~rownames(.x))
markergenes_ls <- markergenes_ls
names(markergenes_ls) <- names(markergenes_ls) #%>% stringr::str_replace_all("/","\n")
markergenes_n <- purrr::map(markergenes_ls, ~length(.x))
markergenes <- unlist(markergenes_ls)clusters <- sce_sub[[paste0(celltype_name_pre,"_clusters_final")]]
clucol <- dic$colors
names(clucol) <- dic$column_names
samples <- sce_sub$Sample
samcol <- sample_cols(unique(samples))
names(samcol) <- unique(samples)
diagnosis <- sce_sub$Diagnosis_main
diagcol <- get_colors("diagnosis")
diagcol <- diagcol[names(diagcol) %in% unique(sce_sub$Diagnosis_main)]
clusters_samples <- paste0(clusters,"-",diagnosis,"-", samples)
mataggr <- summarizeAssayByGroup(logcounts(sce_sub),clusters_samples, subset.row=markergenes)
tmpcoldat <- colData(sce_sub) %>%
as.data.frame() %>%
dplyr::mutate(tmp_clusters_final=!!dplyr::sym(paste0(celltype_name_pre,"_clusters_final"))) %>%
dplyr::left_join(data.frame(tmp_clusters_final=factor(order_celltypes),
tmp_celltype_order=seq_along(unique(sce_sub[[paste0(celltype_name_pre,"_clusters_final")]]))),
by="tmp_clusters_final") %>%
dplyr::arrange(tmp_celltype_order, Diagnosis_main, Sample)
order_samples <- tmpcoldat %>%
dplyr::select(tmp_clusters_final, Diagnosis_main, Sample) %>%
unique() %>%
dplyr::mutate(tmpname=paste0(stringr::str_replace_all(tmp_clusters_final,"/","\n"),"-",Diagnosis_main,"-", Sample)) %>%
dplyr::pull()
mataggr <- mataggr[,order_samples]
colnamessplit <- stringr::str_split(colnames(mataggr),"-")
clustersaggr <- purrr::map_chr(colnamessplit,~.x[1])
diagcolsaggr <- purrr::map_chr(colnamessplit,~.x[2])
samplesaggr <- purrr::map_chr(colnamessplit,~.x[3])
tmpass <- t(apply(assay(mataggr,"mean"),1,scale))
colnames(tmpass) <- colnames(assay(mataggr,"mean"))
assay(mataggr,"mean_scale") <- tmpass
order_samples <- colnames(mataggr)[order(colnames(mataggr))]
library(ComplexHeatmap)
ha <- ComplexHeatmap::HeatmapAnnotation(
`Cell type` = factor(
clustersaggr,
levels = unique(clustersaggr),
labels = paste0(unique(clustersaggr)," - ",purrr::map_chr(unique(clustersaggr), ~dic[[paste0(celltype_name_pre,"_celltype")]][dic[[paste0(celltype_name_pre,"_clusters_final")]] == .x]))),
# Diagnosis=diagcolsaggr,
Sample = samplesaggr,
col=list(`Cell type`=clucol,Sample=samcol,Diagnosis=diagcol),
annotation_legend_param=list(labels_gp = gpar(fontsize=16),
title_gp = gpar(fontsize=20,fontface="bold")))
ht_opt$TITLE_PADDING = unit(c(4, 20), "points")
ht <- ComplexHeatmap::Heatmap(
assay(mataggr,"mean_scale"),
heatmap_legend_param = list(title = "Scaled expression",fontsize=20,gap=unit(20, "mm"),
labels_gp = gpar(fontsize=16),
title_gp = gpar(fontsize=20,fontface="bold")),
cluster_rows = FALSE,
cluster_columns=FALSE,
column_order=order_samples,
show_column_names=FALSE,
column_split=factor(clustersaggr,levels = unique(clustersaggr)),
column_title = NULL,
column_gap = unit(0.2, "mm"),
row_split=factor(unlist(purrr::map(seq_along(markergenes_n),~rep(names(markergenes_n)[.x],markergenes_n[[.x]]))),
levels = unique(clustersaggr)),
row_title = NULL
)
hm_ls[[celltype_name_pre]] <- ha %v% ht
hm_ls[[celltype_name_pre]] 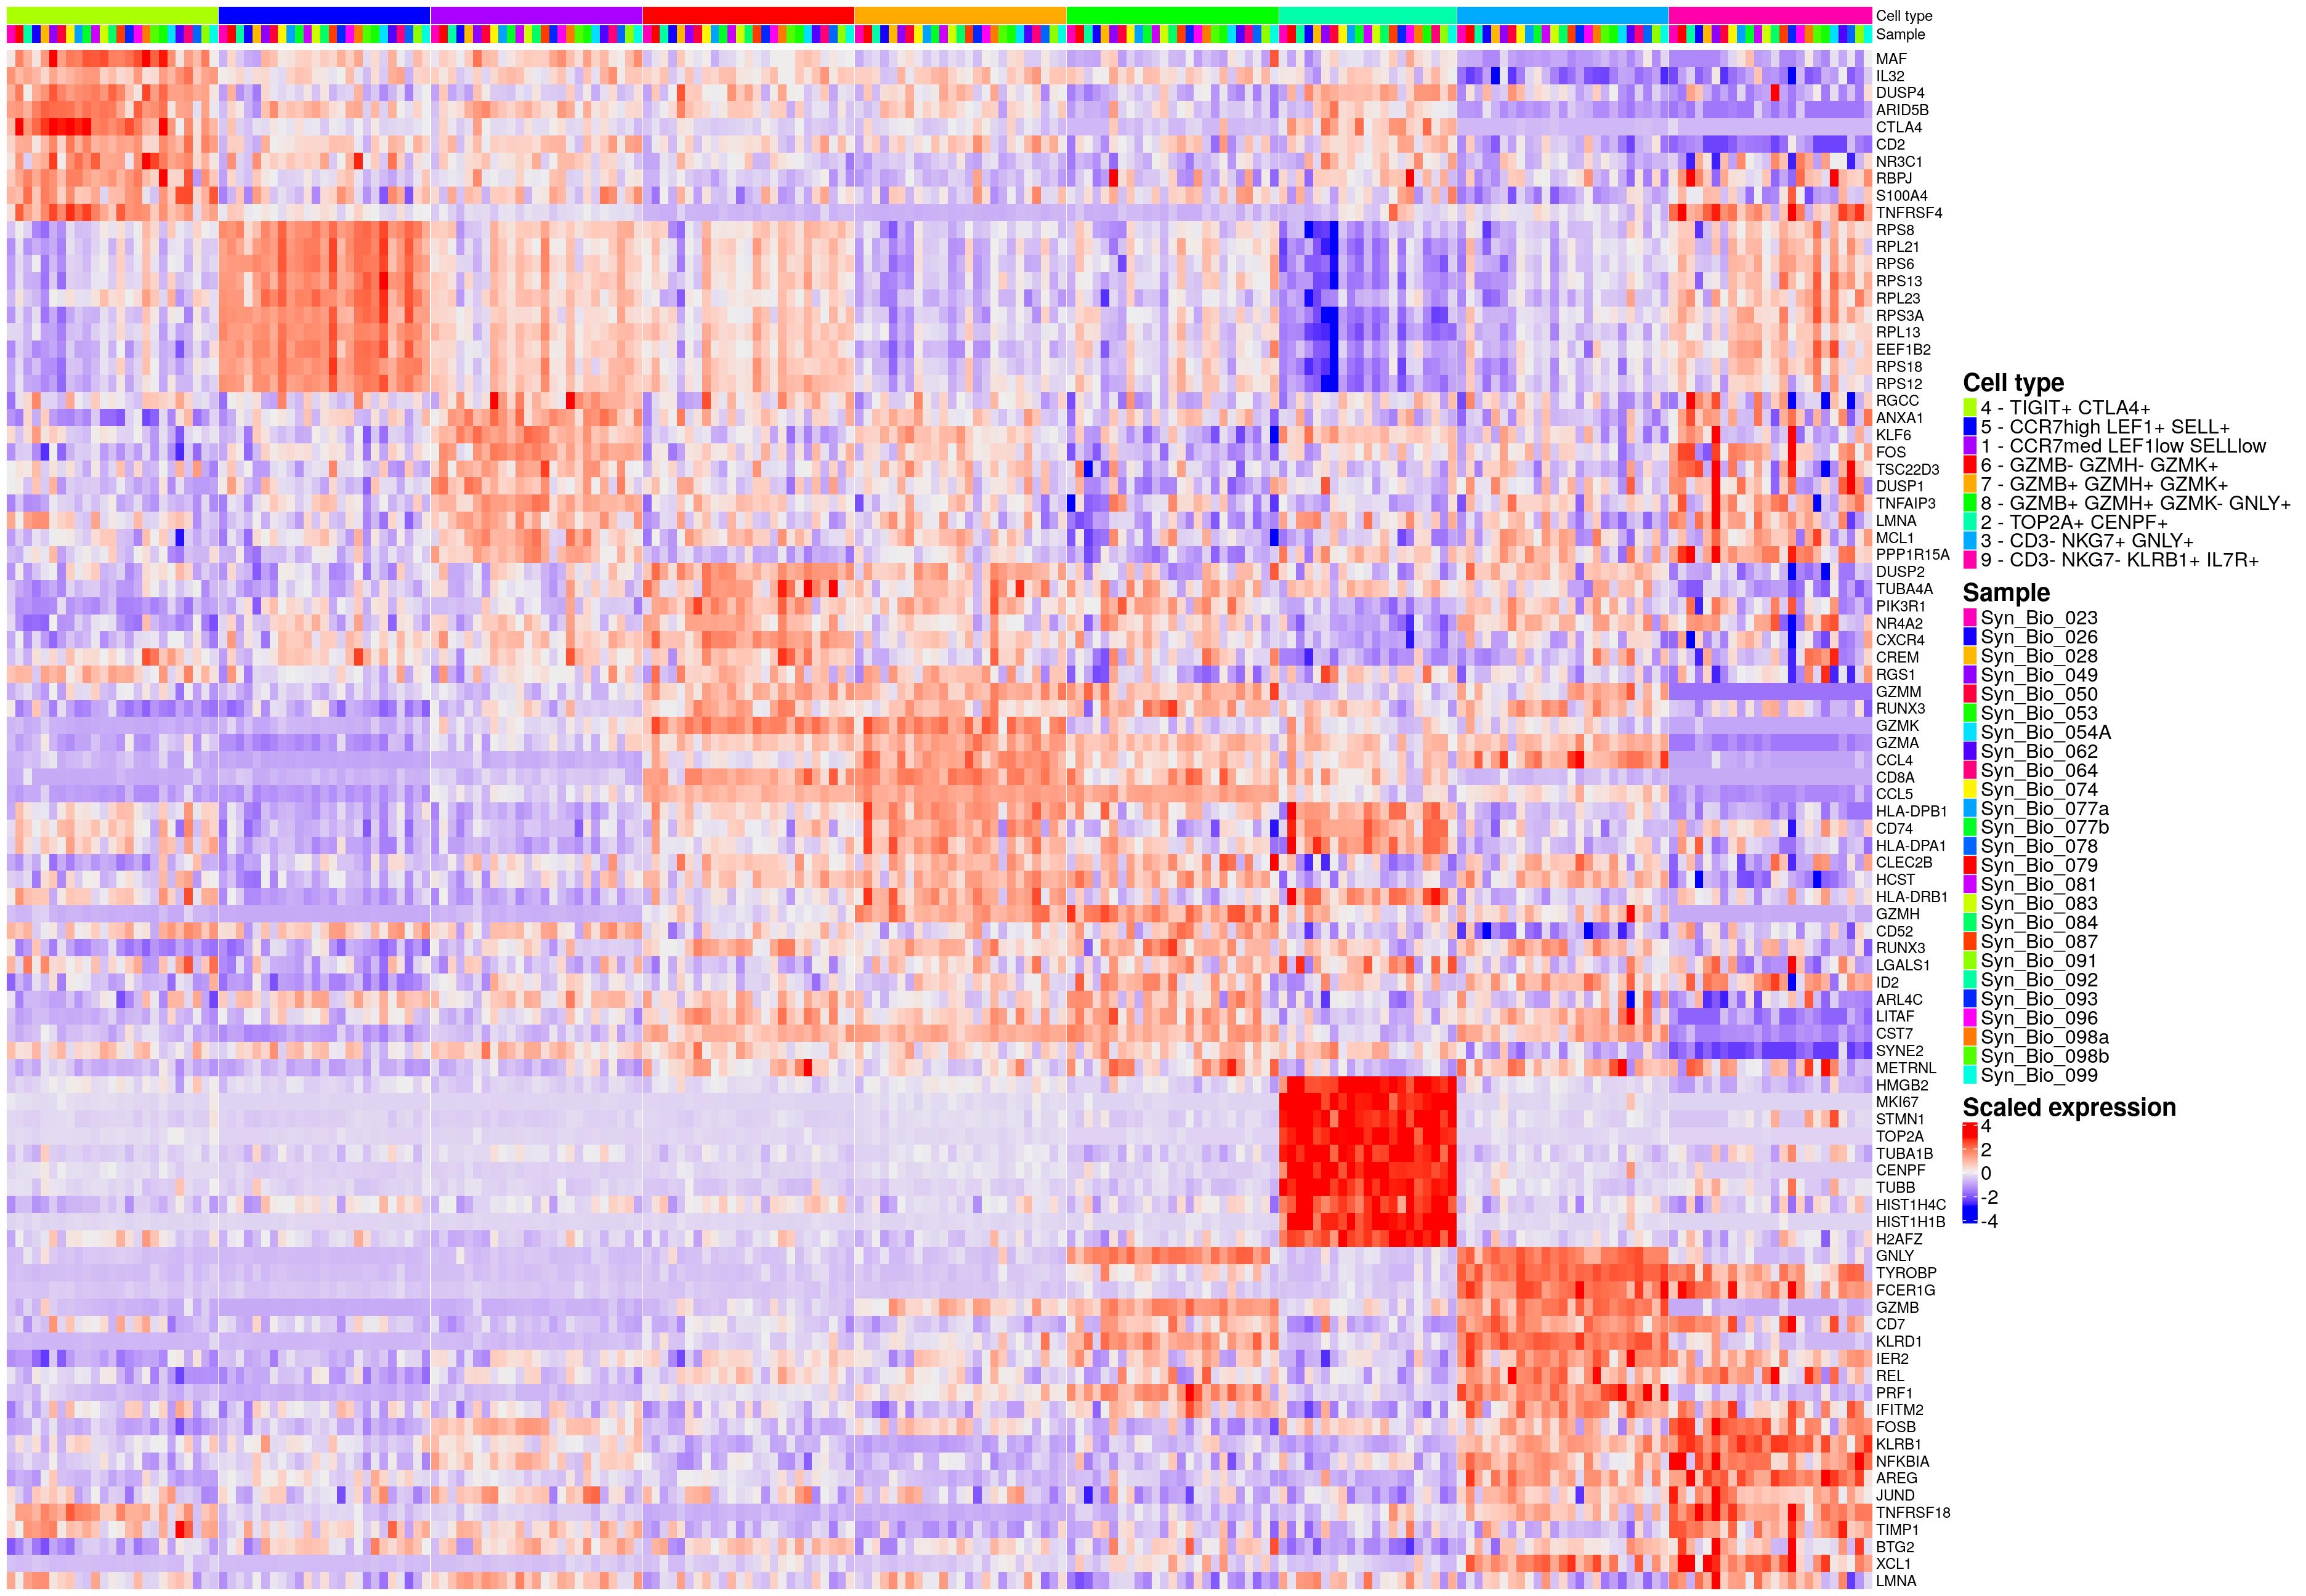
findMarkers - EC
celltype_name_pre <- "ec"
order_celltypes <- c(2,6,3,5,8,1,4,7)
used_clustering <- "ec_clusters_final"
# order_celltypes <- NULL
tmpfilename <- paste0("syn_v",analysis_version,"_sce_",celltype_name_pre,dplyr::if_else(remove_low_quality_samples, "_invivo",""),".rds")
sce_sub <- readRDS(file = here::here("output",tmpfilename))
if(is.null(sce_sub[[paste0(celltype_name_pre,"_celltype")]])){
sce_sub[[paste0(celltype_name_pre,"_clusters_final")]] <- as.integer(sce_sub[[used_clustering]])
sce_sub[[paste0(celltype_name_pre,"_celltype")]] <- as.integer(sce_sub[[paste0(celltype_name_pre,"_clusters_final")]])
}
if(is.null(order_celltypes)){
order_celltypes <- sort(unique(sce_sub[[paste0(celltype_name_pre,"_celltype")]]))
}
format(object.size(sce_sub),units="Mb")[1] "720.2 Mb"colLabels(sce_sub) <- colData(sce_sub)[[paste0(celltype_name_pre,"_celltype")]]
sce_sub_red <- sce_sub
sce_sub_red <- sce_sub_red[rowData(sce_sub_red)$is_hvg,]
colData(sce_sub_red) <- NULL
rowData(sce_sub_red) <- NULL
counts(sce_sub_red) <- NULL
assay(sce_sub_red,"reconstructed") <- NULL
metadata(sce_sub_red) <- list()
reducedDims(sce_sub_red) <- list()
colLabels(sce_sub_red) <- colData(sce_sub)[[paste0(celltype_name_pre,"_celltype")]]
as(sce_sub_red, "SingleCellExperiment")class: SingleCellExperiment
dim: 3809 9378
metadata(0):
assays(1): logcounts
rownames(3809): SAMD11 HES4 ... BX004987.1 AL354822.1
rowData names(0):
colnames(9378): Syn_Bio_079.AAACCCACACATCCCT
Syn_Bio_079.AAACGCTGTCGGCCTA ... Syn_Bio_050.TTTCGATAGGGACCAT-1
Syn_Bio_050.TTTGATCTCCCTCTCC-1
colData names(1): label
reducedDimNames(0):
altExpNames(0):format(object.size(sce_sub_red),units="Mb")[1] "45.4 Mb"markers <- findMarkers(sce_sub_red, test.type = "wilcox", pval.type = "all", direction="up",
lfc=0.5, block=sce_sub$Sample)
saveRDS(markers,here::here("output",paste0("findMarkers_results_v",analysis_version,"_",celltype_name_pre,".rds")))
topmarkers <- purrr::map(seq_along(markers), function(i){
markers[[i]] %>%
as.data.frame() %>%
dplyr::arrange(FDR) %>%
dplyr::select(FDR) %>%
head(n=10)
})
names(topmarkers) <- names(markers)
topmarkers$`ACKRhigh IL1R1+ CLU+ SELE+ venous`
FDR
CTSC 1
CCL14 1
NPC2 1
FABP5 1
MGP 1
CCN2 1
POSTN 1
DUSP23 1
PIM3 1
TNFSF10 1
$`ACKRhigh IL1R1+ CLU+ SELEhigh TNFAIP3+ venous`
FDR
SELE 1.129818e-06
ICAM1 1.000000e+00
CCL2 1.000000e+00
C2CD4B 1.000000e+00
NFKBIA 1.000000e+00
IRF1 1.000000e+00
KLF4 1.000000e+00
IER3 1.000000e+00
BHLHE40 1.000000e+00
MT2A 1.000000e+00
$`ACKRhigh IL1R1+ CLU+ VCAN+ venous`
FDR
TXNIP 1
CLU 1
ID3 1
GIMAP7 1
NKTR 1
RAMP3 1
TSC22D3 1
IGFBP4 1
DAAM1 1
ADIRF 1
$`ACKRmed CLU- SPARChigh`
FDR
ITM2A 1
COTL1 1
CCND1 1
PRSS23 1
GASK1B 1
CTHRC1 1
LGALS1 1
MCAM 1
ITGA6 1
HSPA5 1
$`GJA4+ CLDN5+ arterial`
FDR
CXCL12 5.932051e-18
SRP14 3.805272e-16
SRGN 1.279765e-13
PODXL 2.956143e-12
SLC9A3R2 3.188914e-12
IFI27 4.897143e-11
PPA1 5.478173e-11
EFNB2 2.368980e-09
ICAM2 2.611863e-08
GJA4 4.971547e-08
$`KDR+ SPP1+ SPARChigh capillary`
FDR
FLT1 1
PLVAP 1
COL4A1 1
KDR 1
MLEC 1
MEF2C 1
RGCC 1
GSN 1
ETS1 1
C1orf54 1
$`LYVE1+ PROX1+ CCL21+ lymphatic`
FDR
MMRN1 4.333056e-06
TFPI 4.333056e-06
TFF3 4.333056e-06
EFEMP1 5.559318e-06
CCL21 5.559318e-06
LYVE1 5.559318e-06
PDPN 5.220037e-04
COLEC12 7.220345e-04
LAPTM5 9.048423e-04
GYPC 9.949943e-04
$`TOP2A+ CENPF+ proliferating`
FDR
CDK1 1.315584e-08
MKI67 1.785725e-08
TPX2 1.866667e-08
CENPF 3.977464e-08
TOP2A 4.828200e-07
HMGB2 7.187750e-07
PBK 3.169123e-06
PTTG1 9.201280e-06
HMGN2 1.278876e-05
HIST1H4C 4.326646e-05column <- paste0(celltype_name_pre,"_clusters_final")
column_labels <- paste0(celltype_name_pre,"_celltype")
sce_sub[[column]] <- factor(sce_sub[[column]],levels = order_celltypes)
dic <- unique(as.data.frame(colData(sce_sub)[,c(column,column_labels)])) %>%
dplyr::arrange(!!dplyr::sym(column))
# subcelltype_colors <- viridis::viridis(length(dic[[column]]))
subcelltype_colors <- rainbow(length(dic[[column]]))[order(as.character(dic[[column]]))]
names(subcelltype_colors) <- dic[[column]]
column_names <- paste0(dic[[column]], " - ",dic[[column_labels]])
dic$colors <- subcelltype_colors
dic$column_names <- column_names
markergenes_ls <-
list(
`1`=c("PECAM1"),
`2`=c("GJA4","SEMA3G","IGFBP3","CXCL12","CLDN5","SRGN","LTBP4","RHOB","PLPP1","EFNB2","ARL15","CRYBG3","MECOM","SLC9A3R2","ICAM2","PPA1"),
`6`=c("SPP1","RFLNB","PLPP3","RGCC","EXOC3L2","ITIH5","MLEC","COL13A1","KDR","PLVAP","COL15A1","COL4A1","COL4A2","SPARC","FLT1","RGCC"),
`3`=c("VWF","HLA-DRB1","HLA-DRA","HLA-DPA1","HLA-DPB1","SELP","NR2F2","ACKR1","DAAM1","FBLN2","CLU","ADIRF","SNCG","LIFR","IL33","IL1R1","IRF1","CCL2","SELE","SOCS3","NFKBIA","ICAM1","SOD2","IL6","VCAN","C2CD4B","CCL2","CDKN1A","MT2A","TNFAIP3"),
`5`=c("IGF1","LAPTM5","MAF","PROX1","PDPN","AKAP12","LYVE1","EFEMP1","TFF3","CCL21","MARCKS","COLEC12","TFPI"),
`8`=c("CENPF","MKI67","TOP2A")
)
markergenes_n <- purrr::map(markergenes_ls, ~length(.x))
markergenes <- unlist(markergenes_ls)clusters <- sce_sub[[paste0(celltype_name_pre,"_clusters_final")]]
clucol <- dic$colors
names(clucol) <- dic$column_names
samples <- sce_sub$Sample
samcol <- sample_cols(unique(samples))
names(samcol) <- unique(samples)
diagnosis <- sce_sub$Diagnosis_main
diagcol <- get_colors("diagnosis")
diagcol <- diagcol[names(diagcol) %in% unique(sce_sub$Diagnosis_main)]
clusters_samples <- paste0(clusters,"-",diagnosis,"-", samples)
mataggr <- summarizeAssayByGroup(logcounts(sce_sub),clusters_samples, subset.row=markergenes)
tmpcoldat <- colData(sce_sub) %>%
as.data.frame() %>%
dplyr::mutate(tmp_clusters_final=!!dplyr::sym(paste0(celltype_name_pre,"_clusters_final"))) %>%
dplyr::left_join(data.frame(tmp_clusters_final=factor(order_celltypes),
tmp_celltype_order=seq_along(unique(sce_sub[[paste0(celltype_name_pre,"_clusters_final")]]))),
by="tmp_clusters_final") %>%
dplyr::arrange(tmp_celltype_order, Diagnosis_main, Sample)
order_samples <- tmpcoldat %>%
dplyr::select(tmp_clusters_final, Diagnosis_main, Sample) %>%
unique() %>%
dplyr::mutate(tmpname=paste0(stringr::str_replace_all(tmp_clusters_final,"/","\n"),"-",Diagnosis_main,"-", Sample)) %>%
dplyr::pull()
mataggr <- mataggr[,order_samples]
colnamessplit <- stringr::str_split(colnames(mataggr),"-")
clustersaggr <- purrr::map_chr(colnamessplit,~.x[1])
diagcolsaggr <- purrr::map_chr(colnamessplit,~.x[2])
samplesaggr <- purrr::map_chr(colnamessplit,~.x[3])
tmpass <- t(apply(assay(mataggr,"mean"),1,scale))
colnames(tmpass) <- colnames(assay(mataggr,"mean"))
assay(mataggr,"mean_scale") <- tmpass
order_samples <- colnames(mataggr)[order(colnames(mataggr))]
library(ComplexHeatmap)
ha <- ComplexHeatmap::HeatmapAnnotation(
`Cell type` = factor(
clustersaggr,
levels = unique(clustersaggr),
labels = paste0(unique(clustersaggr)," - ",purrr::map_chr(unique(clustersaggr), ~dic[[paste0(celltype_name_pre,"_celltype")]][dic[[paste0(celltype_name_pre,"_clusters_final")]] == .x]))),
# Diagnosis=diagcolsaggr,
Sample = samplesaggr,
col=list(`Cell type`=clucol,Sample=samcol,Diagnosis=diagcol),
annotation_legend_param=list(labels_gp = gpar(fontsize=16),
title_gp = gpar(fontsize=20,fontface="bold")))
ht_opt$TITLE_PADDING = unit(c(4, 20), "points")
ht <- ComplexHeatmap::Heatmap(
assay(mataggr,"mean_scale"),
heatmap_legend_param = list(title = "Scaled expression",fontsize=20,gap=unit(20, "mm"),
labels_gp = gpar(fontsize=16),
title_gp = gpar(fontsize=20,fontface="bold")),
cluster_rows = FALSE,
cluster_columns=FALSE,
column_order=order_samples,
show_column_names=FALSE,
column_split=factor(clustersaggr,levels = unique(clustersaggr)),
column_title = NULL,
column_gap = unit(0.2, "mm"),
row_split=factor(unlist(purrr::map(seq_along(markergenes_n),~rep(names(markergenes_n)[.x],markergenes_n[[.x]]))),
levels = unique(clustersaggr)),
row_title = NULL
)
hm_ls[[celltype_name_pre]] <- ha %v% ht
hm_ls[[celltype_name_pre]] 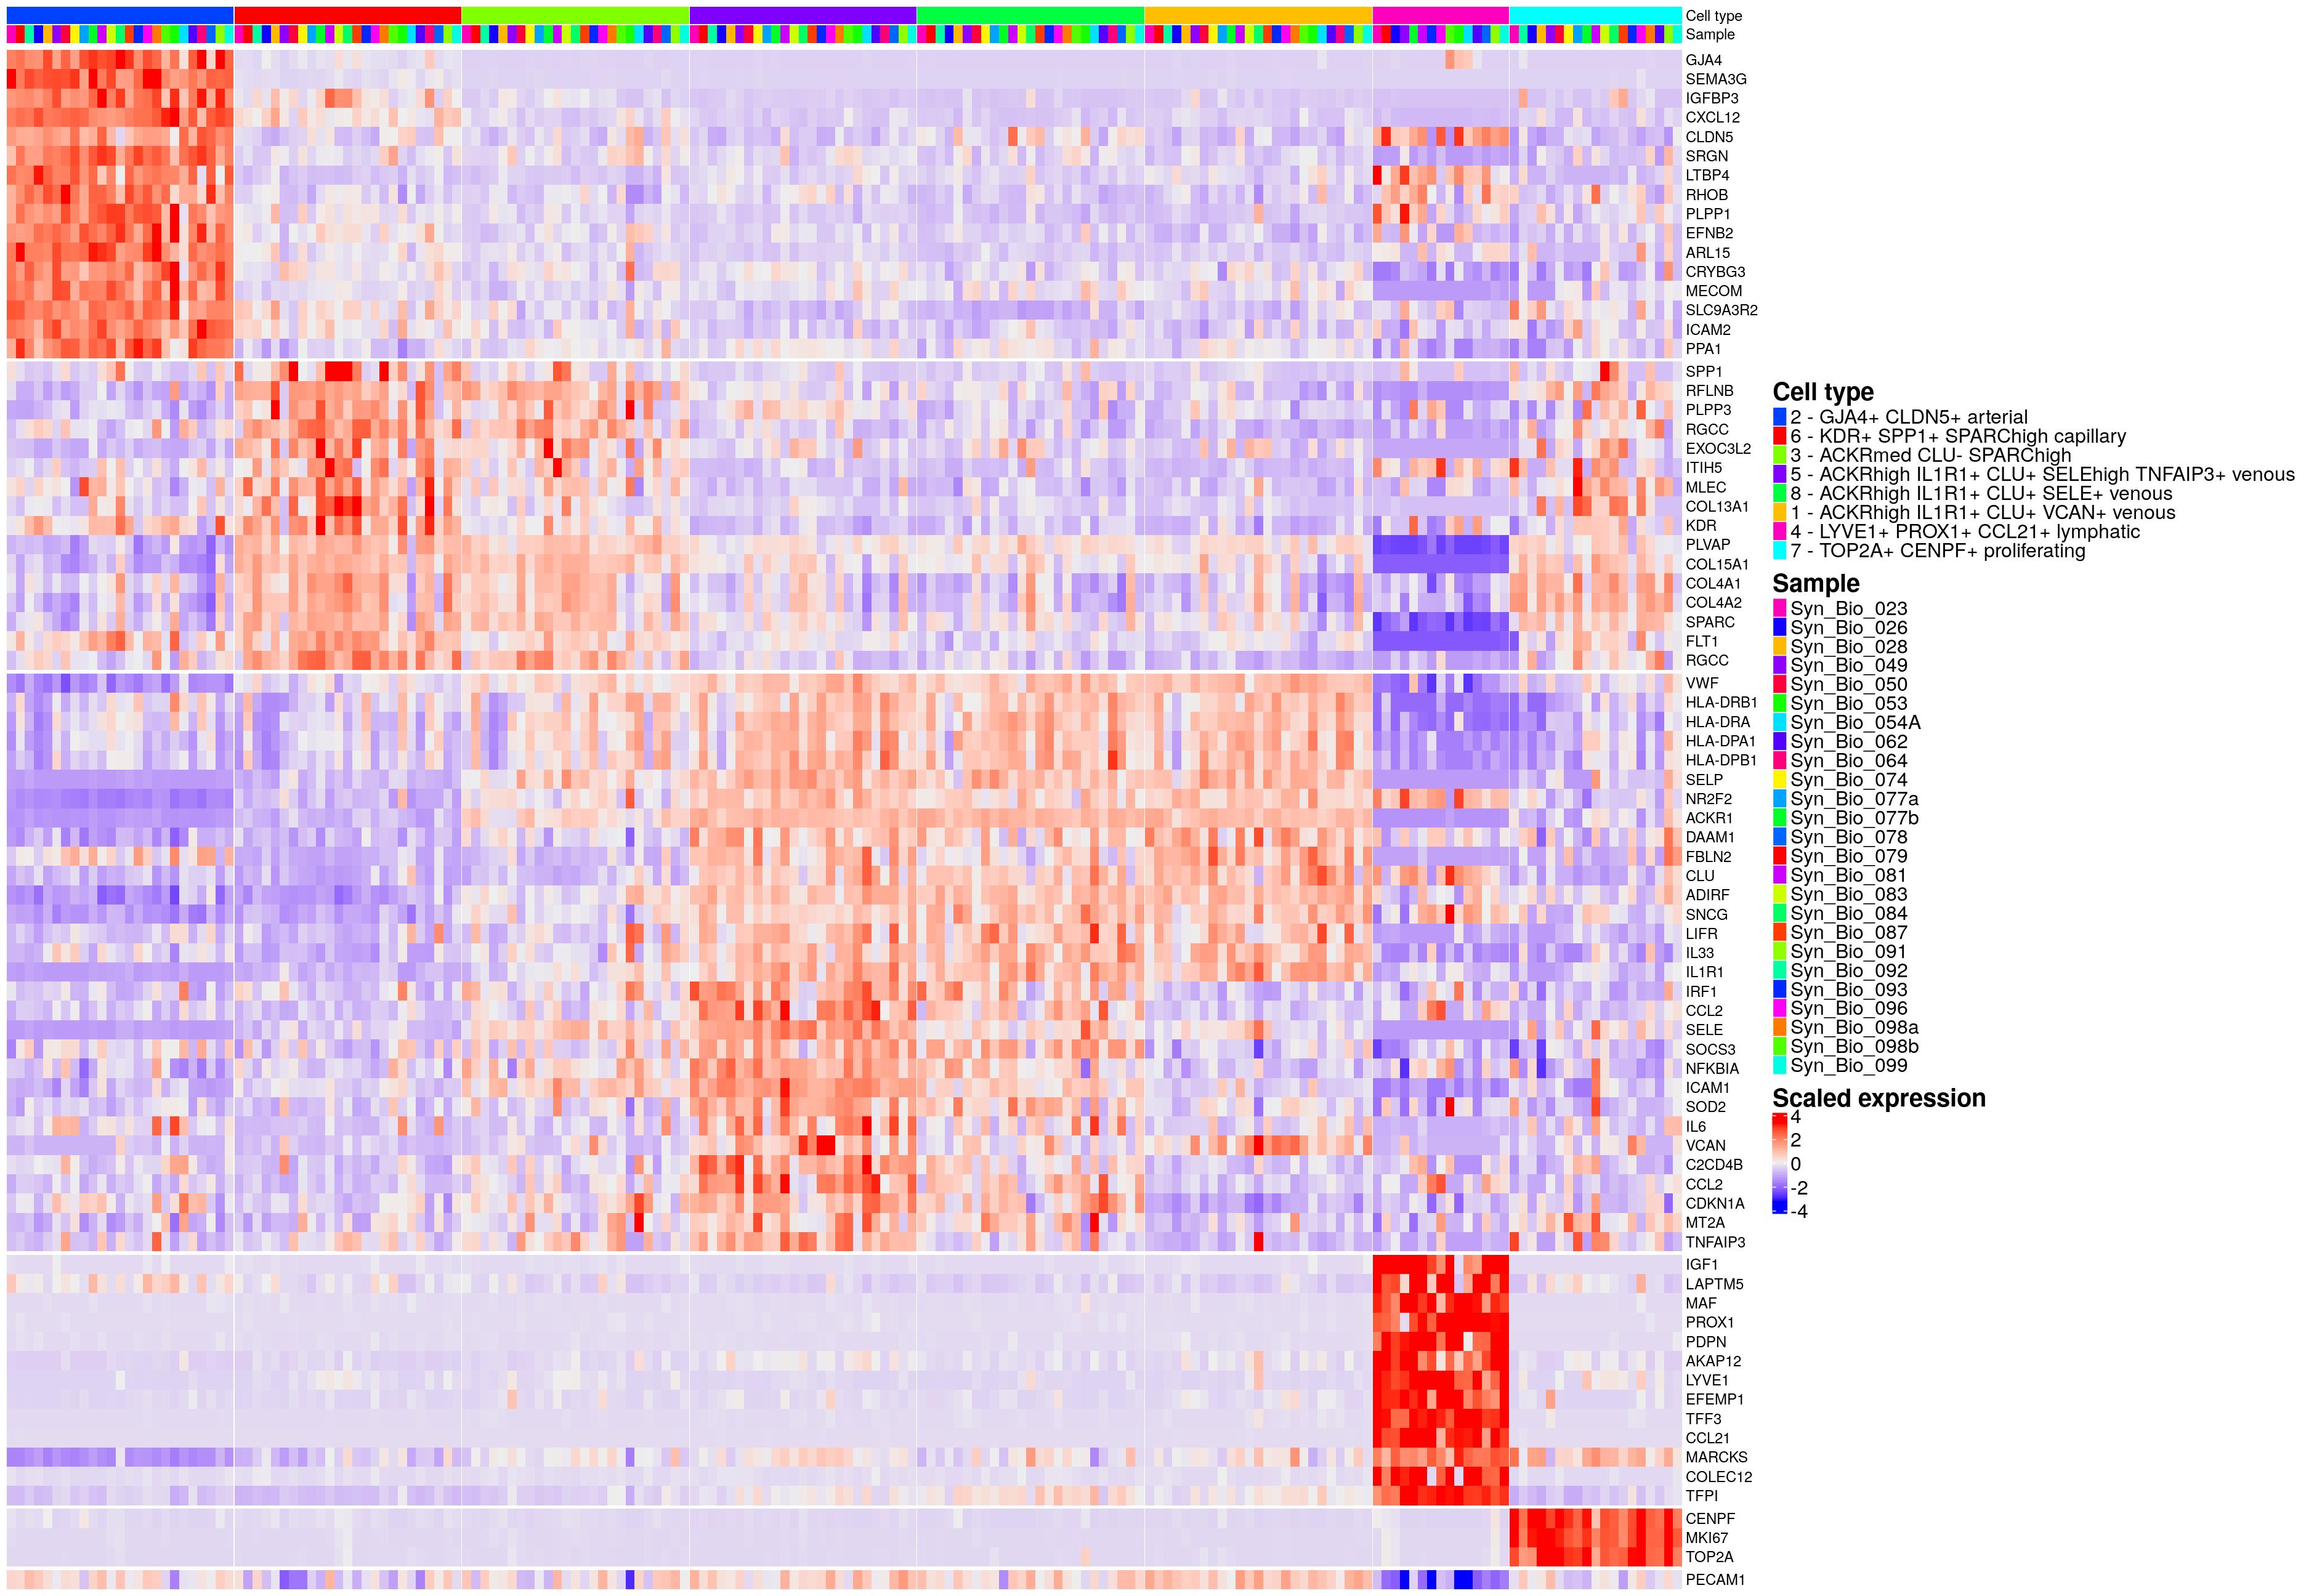
supplementary figure 11
celltype_name_pre <- "tc"
order_celltypes <- c(4,5,1,6,7,8,2,3,9)
used_clustering <- "tc_clusters_final"
tmpfilename <- paste0("syn_v",analysis_version,"_sce_",celltype_name_pre,"_invivo",".rds")
sce_sub_tc <- readRDS(file = here::here("output",tmpfilename))
sce <- sce_sub_tc
if(is.null(sce[[paste0(celltype_name_pre,"_celltype")]])){
  sce[[paste0(celltype_name_pre,"_clusters_final")]] <- as.integer(sce[[used_clustering]])
  sce[[paste0(celltype_name_pre,"_celltype")]] <- as.integer(sce[[paste0(celltype_name_pre,"_clusters_final")]])
}
if(is.null(order_celltypes)){
  order_celltypes <- sort(unique(sce[[paste0(celltype_name_pre,"_celltype")]]))
}
rownames(sce)[stringr::str_detect(rownames(sce),"PDCD1")]
[1] "PDCD1" "PDCD10" "PDCD1LG2" "PDCD11" celltype_centers <- get_celltype_centers(sce, "UMAP_corrected", "tc_clusters_final")
celltype_centers %<>% move_label(0.5,"Y","2")
celltype_centers %<>% move_label(1,"X","3")
celltype_centers %<>% move_label(1,"X","8")
celltype_centers %<>% move_label(0.5,"Y","8")
celltype_centers %<>% move_label(1,"X","9")
genes_to_plot <- c("TIGIT","CTLA4","FOXP3", "PDCD1","CXCL13")
genes_to_plot <- genes_to_plot[genes_to_plot %in% rownames(sce)]
pltls <- purrr::map(genes_to_plot, ~{
plotReducedDim(sce,"UMAP_corrected",colour_by = .x, point_size=0.1) +
labs(x="UMAP 1", y="UMAP 2") +
geom_label(aes(V1,V2,label=V3),data=celltype_centers) +
main_plot_theme() +
labs(title=.x)
})
pl8b <- ggpubr::ggarrange(plotlist=pltls, ncol = 5, nrow = 1, font.label=list(size=26))
genes_to_plot <- c("TOP2A","CENPF")
genes_to_plot <- genes_to_plot[genes_to_plot %in% rownames(sce)]
pltls <- purrr::map(genes_to_plot, ~{
plotReducedDim(sce,"UMAP_corrected",colour_by = .x, point_size=0.1) +
labs(x="UMAP 1", y="UMAP 2") +
geom_label(aes(V1,V2,label=V3),data=celltype_centers) +
main_plot_theme() +
labs(title=.x)
})
pl8c <- ggpubr::ggarrange(plotlist=pltls, ncol = 5, nrow = 1, font.label=list(size=26))
genes_to_plot <- c("GZMK", "GZMB", "GZMH","GNLY")
genes_to_plot <- genes_to_plot[genes_to_plot %in% rownames(sce)]
pltls <- purrr::map(genes_to_plot, ~{
plotReducedDim(sce,"UMAP_corrected",colour_by = .x, point_size=0.1) +
labs(x="UMAP 1", y="UMAP 2") +
geom_label(aes(V1,V2,label=V3),data=celltype_centers) +
main_plot_theme() +
labs(title=.x)
})
pl8d <- ggpubr::ggarrange(plotlist=pltls, ncol = 5, nrow = 1, font.label=list(size=26))
plt <- ggpubr::ggarrange(
pl8c,
grid.grabExpr(draw(hm_ls[["tc"]],align_annotation_legend="heatmap_center",newpage = FALSE, merge_legends=TRUE,align_heatmap_legend="heatmap_center",padding = unit(c(10, 10, 10, 10), "mm")), width = 22, height = 20,wrap=TRUE),
pl8b,
pl8d,
labels = "auto", ncol=1, nrow=4, font.label=list(size=26), heights = c(2,7,2,2)
)
figname <- "Suppl_Figure_11"
width <- 22
height <- 26
res = 300
maxwidth <- 8.5
maxheight <- 11
downscale <- max(c(3,height/maxheight, width/maxwidth))
# ideally multiply by 'downscale' but imagemagick throws error for too large images
initres <- res*1.2
magick_geometry <- paste0(width/downscale*res,"x",height/downscale*res)
plt <- plt +
labs(title=paste0("Figure S",stringr::str_extract(figname,"[[:digit:]]+$"))) +
theme(plot.title = element_text(size=10*downscale))
tiff(here::here("..","synovialscrnaseq","output","Figures_Paper",paste0(figname,".tiff")),width=width,height=height,res = initres, units = "in", compression="zip")
plt + theme(plot.title = element_text(size=10*downscale, family="Arial"))
dev.off()pdf
2 system(paste0("convert -geometry ",magick_geometry," ", here::here("..","synovialscrnaseq","output","Figures_Paper",paste0(figname,".tiff")), " ",here::here("..","synovialscrnaseq","output","Figures_Paper",paste0(figname,".tiff"))))
jpeg(here::here("..","synovialscrnaseq","output","Figures_Paper",paste0(figname,".jpeg")),width=width,height=height,res = initres, units = "in")
plt + theme(plot.title = element_text(size=10*downscale, family="Arial"))
dev.off()pdf
2 system(paste0("convert -geometry ",magick_geometry," ", here::here("..","synovialscrnaseq","output","Figures_Paper",paste0(figname,".jpeg")), " ",here::here("..","synovialscrnaseq","output","Figures_Paper",paste0(figname,".jpeg"))))
pdf(here::here("..","synovialscrnaseq","output","Figures_Paper",paste0(figname,".pdf")),width=width,height=height)
plt
dev.off()pdf
2 Supplementary Figure 12
celltype_name_pre <- "sf"
# order_celltypes <- c(5,4,2,6,8,1,7,3)
used_clustering <- "sf_clusters_final"
# order_celltypes <- NULL
order_celltypes <- c(3,7,5,4,6,1,2)
tmpfilename <- paste0("syn_v",analysis_version,"_sce_",celltype_name_pre,"_invivo",".rds")
sce_sub_sf <- readRDS(file = here::here("output",tmpfilename))
sce <- sce_sub_sf
if(is.null(sce[[paste0(celltype_name_pre,"_celltype")]])){
  sce[[paste0(celltype_name_pre,"_clusters_final")]] <- as.integer(sce[[used_clustering]])
  sce[[paste0(celltype_name_pre,"_celltype")]] <- as.integer(sce[[paste0(celltype_name_pre,"_clusters_final")]])
}
if(is.null(order_celltypes)){
  order_celltypes <- sort(unique(sce[[paste0(celltype_name_pre,"_celltype")]]))
}

column <- "sf_clusters_final"
column_labels <- "sf_celltype"
aggr_by="Sample"
facet_by="Sample_prep"
fill_lab = "Fibroblasts"
sce[[column]] <- factor(sce[[column]],levels = order_celltypes)
dic_sf <- unique(as.data.frame(colData(sce)[,c(column,column_labels)])) %>%
  dplyr::arrange(!!dplyr::sym(column))
# subcelltype_colors <- viridis::viridis(length(dic_sf[[column]]))
subcelltype_colors <- rainbow(length(dic_sf[[column]]))[order(as.character(dic_sf[[column]]))]


pl9a <- scater::plotExpression(sce, c("PRG4","THY1"),
                       x=column,colour_by=column, ncol=5) +
    scale_color_manual(values=subcelltype_colors, breaks=names(subcelltype_colors), labels=column_names) +
  main_plot_theme() +
  labs(x="")
Scale for 'colour' is already present. Adding another scale for 'colour',
which will replace the existing scale.celltype_centers <- get_celltype_centers(sce, "UMAP_corrected", column)
genes_to_plot <- c("TOP2A","CENPF")
genes_to_plot <- genes_to_plot[genes_to_plot %in% rownames(sce)]
pltls <- purrr::map(genes_to_plot, ~{
plotReducedDim(sce,"UMAP_corrected",colour_by = .x, point_size=0.1) +
labs(x="UMAP 1", y="UMAP 2") +
geom_label(aes(V1,V2,label=V3),data=celltype_centers) +
main_plot_theme() +
labs(title=.x) +
coord_fixed()
})
pl9b <- ggpubr::ggarrange(plotlist=pltls, ncol = 2, nrow = 1, font.label=list(size=26))
plt <- ggpubr::ggarrange(pl9a,
pl9b,
ncol = 1, nrow = 2,labels = "auto", heights = c(2,2),
font.label=list(size=26))
# plt
figname <- "Suppl_Figure_12"
width <- 16
height <- 16
res = 300
maxwidth <- 8.5
maxheight <- 11
downscale <- max(c(3,height/maxheight, width/maxwidth))
# ideally multiply by 'downscale' but imagemagick throws error for too large images
initres <- res*1.2
magick_geometry <- paste0(width/downscale*res,"x",height/downscale*res)
plt <- plt +
labs(title=paste0("Figure S",stringr::str_extract(figname,"[[:digit:]]+$"))) +
theme(plot.title = element_text(size=10*downscale))
tiff(here::here("..","synovialscrnaseq","output","Figures_Paper",paste0(figname,".tiff")),width=width,height=height,res = initres, units = "in", compression="zip")
plt + theme(plot.title = element_text(size=10*downscale, family="Arial"))
dev.off()pdf
2 system(paste0("convert -geometry ",magick_geometry," ", here::here("..","synovialscrnaseq","output","Figures_Paper",paste0(figname,".tiff")), " ",here::here("..","synovialscrnaseq","output","Figures_Paper",paste0(figname,".tiff"))))
jpeg(here::here("..","synovialscrnaseq","output","Figures_Paper",paste0(figname,".jpeg")),width=width,height=height,res = initres, units = "in")
plt + theme(plot.title = element_text(size=10*downscale, family="Arial"))
dev.off()pdf
2 system(paste0("convert -geometry ",magick_geometry," ", here::here("..","synovialscrnaseq","output","Figures_Paper",paste0(figname,".jpeg")), " ",here::here("..","synovialscrnaseq","output","Figures_Paper",paste0(figname,".jpeg"))))
pdf(here::here("..","synovialscrnaseq","output","Figures_Paper",paste0(figname,".pdf")),width=width,height=height)
plt
dev.off()pdf
2 Supplementary Figure 13
hm <- hm_ls[["sf_new"]]

figname <- "Suppl_Figure_13"
width <- 26
height <- 22
res = 300
maxwidth <- 8.5
maxheight <- 11
downscale <- max(c(3,height/maxheight, width/maxwidth))
# ideally multiply by 'downscale' but imagemagick throws error for too large images
initres <- res*1.2
magick_geometry <- paste0(width/downscale*res,"x",height/downscale*res)


tiff(here::here("..","synovialscrnaseq","output","Figures_Paper",paste0(figname,".tiff")),width=width,height=height,res = initres, units = "in", compression="zip")
draw(hm,
   column_title=paste0("Figure S",stringr::str_extract(figname,"[[:digit:]]+$")),
   column_title_gp=grid::gpar(fontsize=10*downscale,fontfamily="Arial"))
Warning in grid.Call(C_textBounds, as.graphicsAnnot(x$label), x$x, x$y, : font
family 'Arial' not found in PostScript font database
Warning in grid.Call(C_textBounds, as.graphicsAnnot(x$label), x$x, x$y, : font
family 'Arial' not found in PostScript font database
Warning in grid.Call(C_textBounds, as.graphicsAnnot(x$label), x$x, x$y, : font
family 'Arial' not found in PostScript font database
Warning in grid.Call(C_textBounds, as.graphicsAnnot(x$label), x$x, x$y, : font
family 'Arial' not found in PostScript font database
Warning in grid.Call(C_textBounds, as.graphicsAnnot(x$label), x$x, x$y, : font
family 'Arial' not found in PostScript font database
Warning in grid.Call(C_textBounds, as.graphicsAnnot(x$label), x$x, x$y, : font
family 'Arial' not found in PostScript font databasedev.off()pdf
2 system(paste0("convert -geometry ",magick_geometry," ", here::here("..","synovialscrnaseq","output","Figures_Paper",paste0(figname,".tiff")), " ",here::here("..","synovialscrnaseq","output","Figures_Paper",paste0(figname,".tiff"))))
jpeg(here::here("..","synovialscrnaseq","output","Figures_Paper",paste0(figname,".jpeg")),width=width,height=height,res = initres, units = "in")
draw(hm,
column_title=paste0("Figure S",stringr::str_extract(figname,"[[:digit:]]+$")),
column_title_gp=grid::gpar(fontsize=10*downscale,fontfamily="Arial"))Warning in grid.Call(C_textBounds, as.graphicsAnnot(x$label), x$x, x$y, : font
family 'Arial' not found in PostScript font database
Warning in grid.Call(C_textBounds, as.graphicsAnnot(x$label), x$x, x$y, : font
family 'Arial' not found in PostScript font database
Warning in grid.Call(C_textBounds, as.graphicsAnnot(x$label), x$x, x$y, : font
family 'Arial' not found in PostScript font database
Warning in grid.Call(C_textBounds, as.graphicsAnnot(x$label), x$x, x$y, : font
family 'Arial' not found in PostScript font database
Warning in grid.Call(C_textBounds, as.graphicsAnnot(x$label), x$x, x$y, : font
family 'Arial' not found in PostScript font database
Warning in grid.Call(C_textBounds, as.graphicsAnnot(x$label), x$x, x$y, : font
family 'Arial' not found in PostScript font databasedev.off()pdf
2 system(paste0("convert -geometry ",magick_geometry," ", here::here("..","synovialscrnaseq","output","Figures_Paper",paste0(figname,".jpeg")), " ",here::here("..","synovialscrnaseq","output","Figures_Paper",paste0(figname,".jpeg"))))
pdf(here::here("..","synovialscrnaseq","output","Figures_Paper",paste0(figname,".pdf")),width=width,height=height)
draw(hm,
column_title=paste0("Figure S",stringr::str_extract(figname,"[[:digit:]]+$")),
column_title_gp=grid::gpar(fontsize=10*downscale))
dev.off()pdf
2 Supplementary Figure 14
celltype_name_pre <- "sf"
# order_celltypes <- c(5,4,2,6,8,1,7,3)
used_clustering <- "sf_clusters_final"
# order_celltypes <- NULL
order_celltypes <- c(3,7,5,4,6,1,2)

tmpfilename <- paste0("syn_v",analysis_version,"_sce_",celltype_name_pre,"_invivo",".rds")
sce_sub_sf <- readRDS(file = here::here("output",tmpfilename))
sce <- sce_sub_sf
if(is.null(sce[[paste0(celltype_name_pre,"_celltype")]])){
  sce[[paste0(celltype_name_pre,"_clusters_final")]] <- as.integer(sce[[used_clustering]])
  sce[[paste0(celltype_name_pre,"_celltype")]] <- as.integer(sce[[paste0(celltype_name_pre,"_clusters_final")]])
}
if(is.null(order_celltypes)){
  order_celltypes <- sort(unique(sce[[paste0(celltype_name_pre,"_celltype")]]))
}

column <- "sf_clusters_final"
column_labels <- "sf_celltype"
aggr_by="Sample"
facet_by="Sample_prep"
fill_lab = "Fibroblasts"
sce[[column]] <- factor(sce[[column]],levels = order_celltypes)
dic_sf <- unique(as.data.frame(colData(sce)[,c(column,column_labels)])) %>%
  dplyr::arrange(!!dplyr::sym(column))
# subcelltype_colors <- viridis::viridis(length(dic_sf[[column]]))
subcelltype_colors <- rainbow(length(dic_sf[[column]]))[order(as.character(dic_sf[[column]]))]

celltype_centers <- get_celltype_centers(sce, "UMAP_corrected", column)

genes_to_plot <- c("CLIC5","HBEGF")
genes_to_plot <- genes_to_plot[genes_to_plot %in% rownames(sce)]
pltls <- purrr::map(genes_to_plot, ~{
  plotReducedDim(sce,"UMAP_corrected",colour_by = .x, point_size=0.1) +
    labs(x="UMAP 1", y="UMAP 2") +
    geom_label(aes(V1,V2,label=V3),data=celltype_centers) +
    main_plot_theme() +
    labs(title=.x) +
    coord_fixed()
  })
pl11a <- ggpubr::ggarrange(plotlist=pltls, ncol = 2, nrow = 1, font.label=list(size=26))

genes_to_plot <- c("HLA-DRA","CD74","HLA-DRB1","HLA-DPB1")
genes_to_plot <- genes_to_plot[genes_to_plot %in% rownames(sce)]
pltls <- purrr::map(genes_to_plot, ~{
  plotReducedDim(sce,"UMAP_corrected",colour_by = .x, point_size=0.1) +
    labs(x="UMAP 1", y="UMAP 2") +
    geom_label(aes(V1,V2,label=V3),data=celltype_centers) +
    main_plot_theme() +
    labs(title=.x) +
    coord_fixed()
  })
pl11b <- ggpubr::ggarrange(plotlist=pltls, ncol = 2, nrow = 2, font.label=list(size=26))

genes_to_plot <- c("NOTCH3","IL6")
genes_to_plot <- genes_to_plot[genes_to_plot %in% rownames(sce)]
pltls <- purrr::map(genes_to_plot, ~{
  plotReducedDim(sce,"UMAP_corrected",colour_by = .x, point_size=0.1) +
    labs(x="UMAP 1", y="UMAP 2") +
    geom_label(aes(V1,V2,label=V3),data=celltype_centers) +
    main_plot_theme() +
    labs(title=.x) +
    coord_fixed()
  })
pl11c <- ggpubr::ggarrange(plotlist=pltls, ncol = 2, nrow = 1, font.label=list(size=26))


plt <- ggpubr::ggarrange(pl11a,
                         pl11b,
                         pl11c,
                         ncol = 1, nrow = 3,labels = "auto",
                         font.label=list(size=26), heights = c(1,2,1),align = "hv")
plt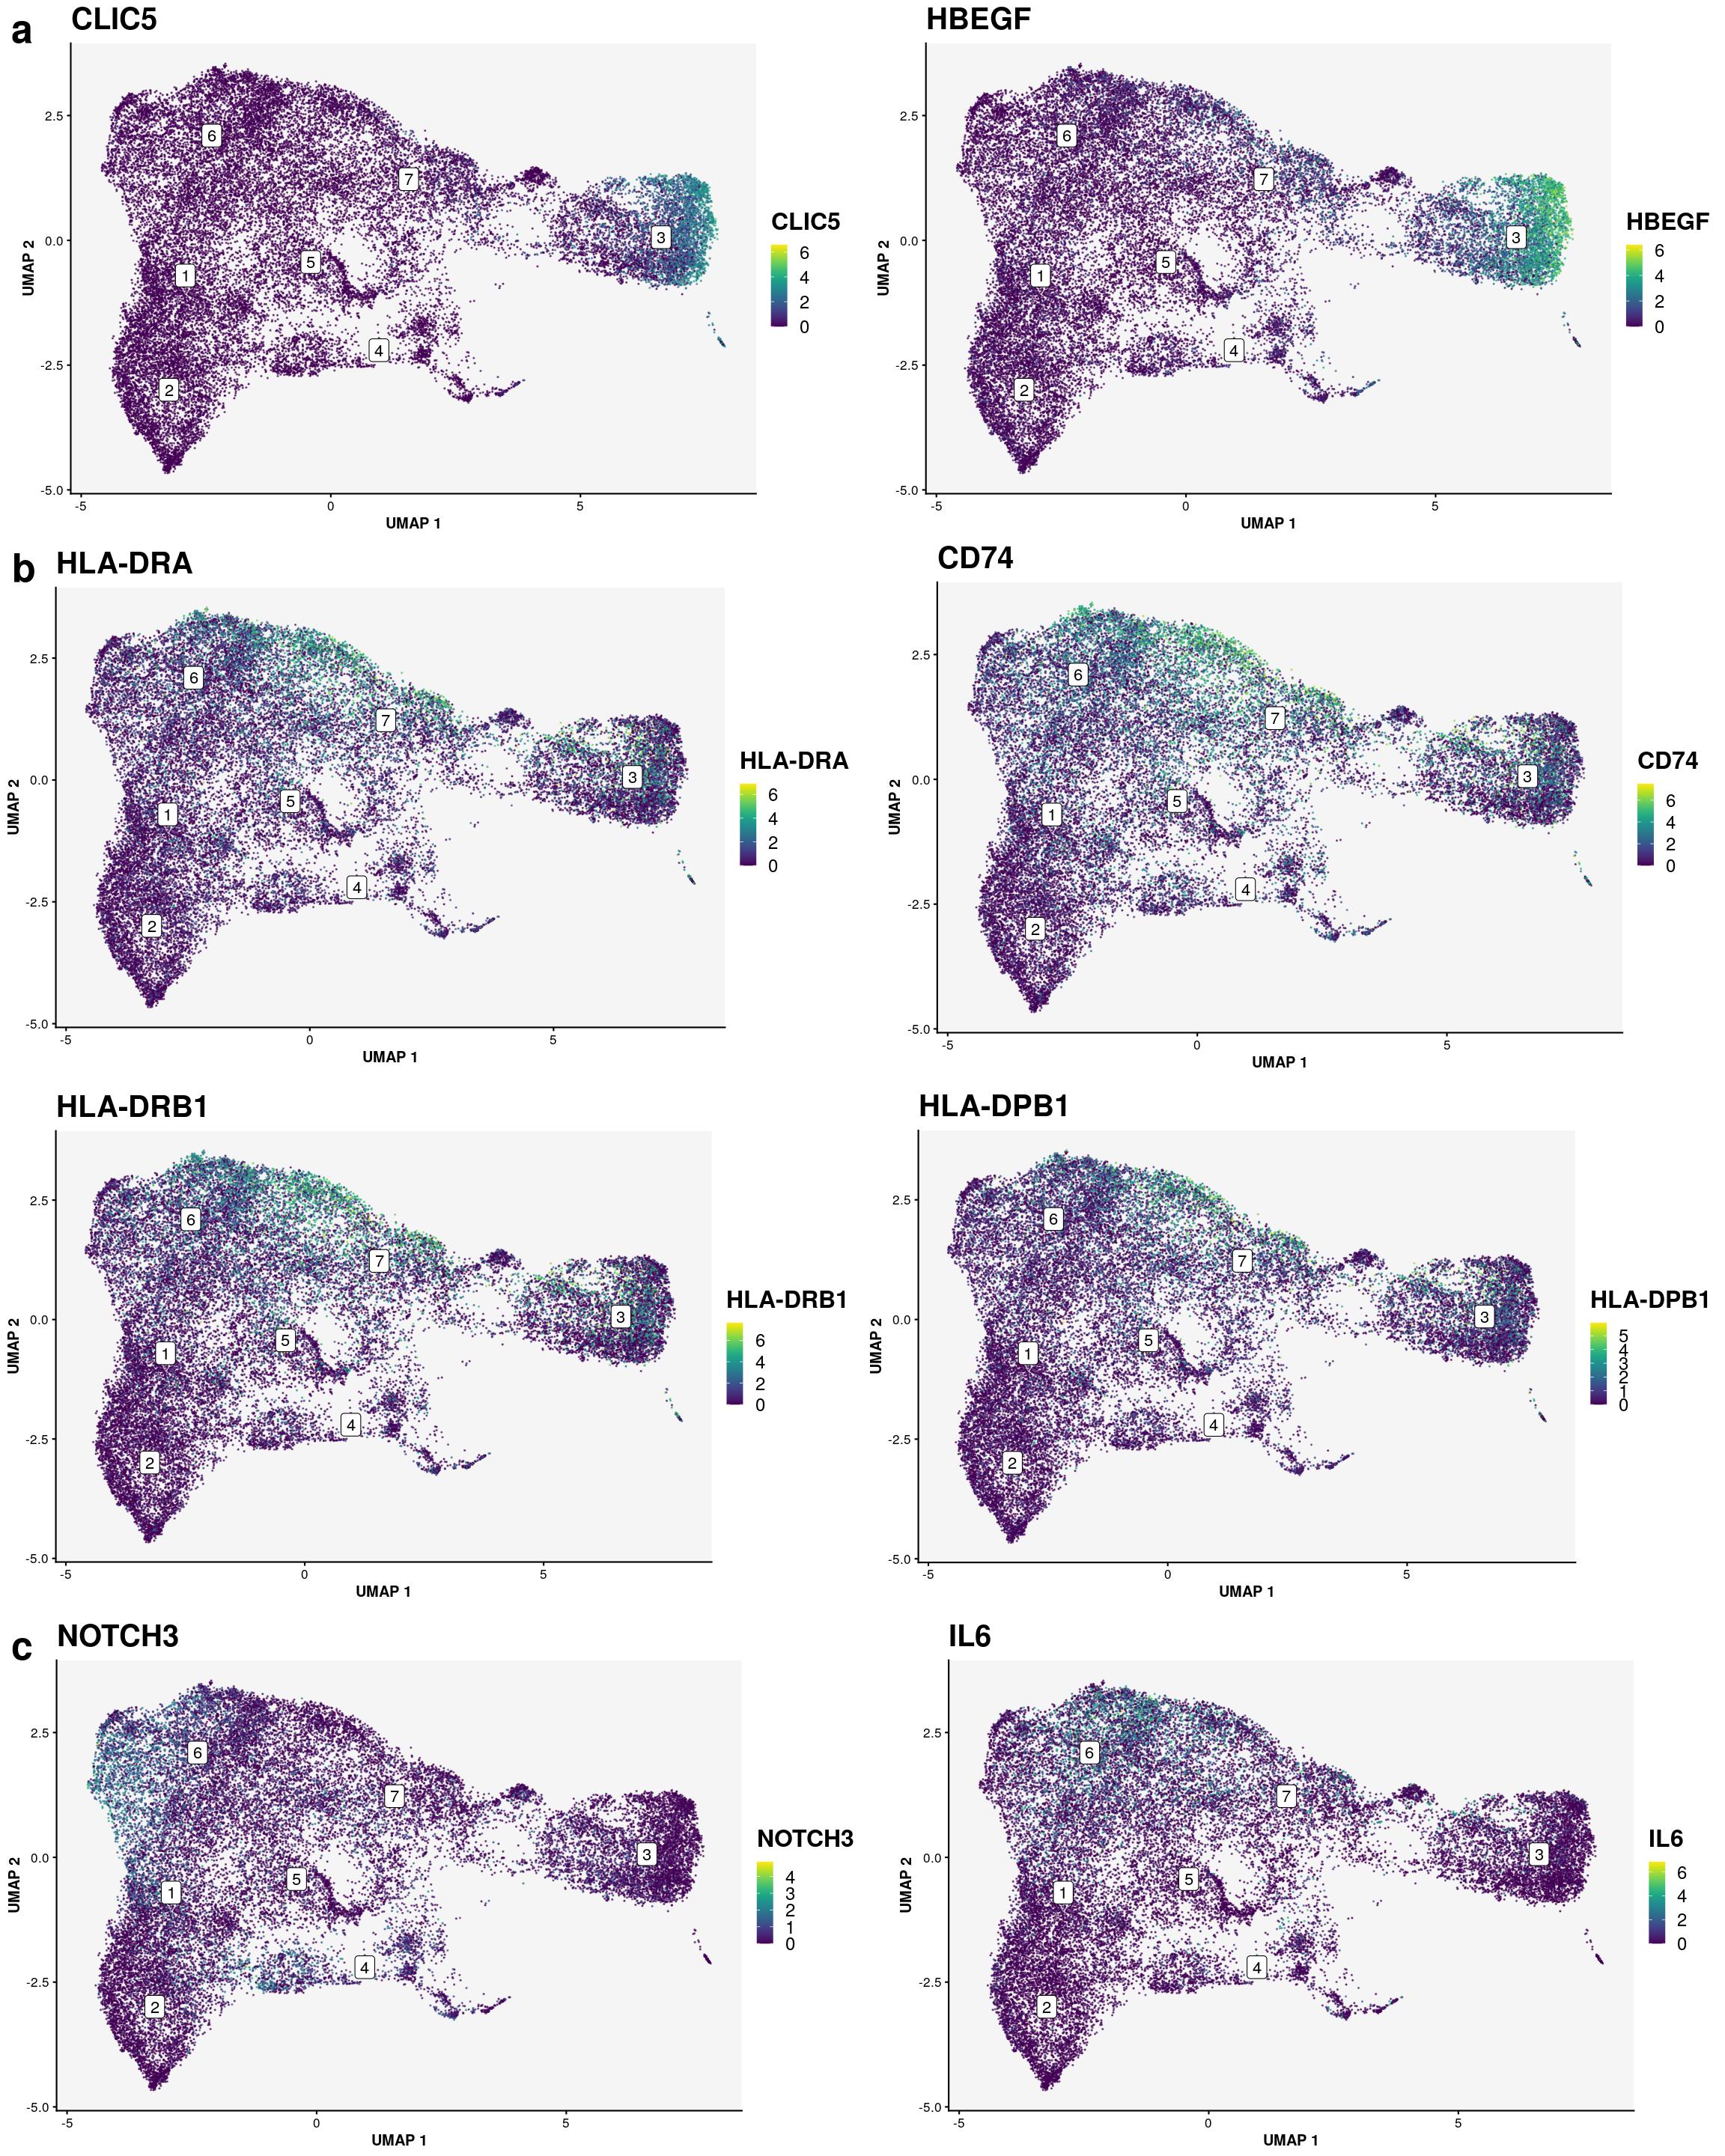
figname <- "Suppl_Figure_14"
width <- 16
height <- 20
res = 300
maxwidth <- 8.5
maxheight <- 11
downscale <- max(c(3,height/maxheight, width/maxwidth))
# ideally multiply by 'downscale' but imagemagick throws error for too large images
initres <- res*1.2
magick_geometry <- paste0(width/downscale*res,"x",height/downscale*res)

plt <- plt +
  labs(title=paste0("Figure S",stringr::str_extract(figname,"[[:digit:]]+$"))) +
  theme(plot.title = element_text(size=10*downscale))

tiff(here::here("..","synovialscrnaseq","output","Figures_Paper",paste0(figname,".tiff")),width=width,height=height,res = initres, units = "in", compression="zip")
plt + theme(plot.title = element_text(size=10*downscale, family="Arial"))
dev.off()
pdf
2 system(paste0("convert -geometry ",magick_geometry," ", here::here("..","synovialscrnaseq","output","Figures_Paper",paste0(figname,".tiff")), " ",here::here("..","synovialscrnaseq","output","Figures_Paper",paste0(figname,".tiff"))))
jpeg(here::here("..","synovialscrnaseq","output","Figures_Paper",paste0(figname,".jpeg")),width=width,height=height,res = initres, units = "in")
plt + theme(plot.title = element_text(size=10*downscale, family="Arial"))
dev.off()pdf
2 system(paste0("convert -geometry ",magick_geometry," ", here::here("..","synovialscrnaseq","output","Figures_Paper",paste0(figname,".jpeg")), " ",here::here("..","synovialscrnaseq","output","Figures_Paper",paste0(figname,".jpeg"))))
pdf(here::here("..","synovialscrnaseq","output","Figures_Paper",paste0(figname,".pdf")),width=width,height=height)
plt
dev.off()pdf
2 Supplementary Figure 15
figname <- "Suppl_Figure_15"
width <- 26
height <- 22
res = 300
maxwidth <- 8.5
maxheight <- 11
downscale <- max(c(3,height/maxheight, width/maxwidth))
# ideally multiply by 'downscale' but imagemagick throws error for too large images
initres <- res*1.2
magick_geometry <- paste0(width/downscale*res,"x",height/downscale*res)


tiff(here::here("..","synovialscrnaseq","output","Figures_Paper",paste0(figname,".tiff")),width=width,height=height,res = initres, units = "in", compression="zip")
   draw(hm_ls[["mp"]], ht_gap = unit(0, "mm"), merge_legends=TRUE, annotation_legend_list = lgd_list,align_annotation_legend="heatmap_center",align_heatmap_legend="heatmap_center",column_title=paste0("Figure S",stringr::str_extract(figname,"[[:digit:]]+$")),
   column_title_gp=grid::gpar(fontsize=10*downscale,fontfamily="Arial"))
Warning in grid.Call(C_textBounds, as.graphicsAnnot(x$label), x$x, x$y, : font
family 'Arial' not found in PostScript font database
Warning in grid.Call(C_textBounds, as.graphicsAnnot(x$label), x$x, x$y, : font
family 'Arial' not found in PostScript font database
Warning in grid.Call(C_textBounds, as.graphicsAnnot(x$label), x$x, x$y, : font
family 'Arial' not found in PostScript font database
Warning in grid.Call(C_textBounds, as.graphicsAnnot(x$label), x$x, x$y, : font
family 'Arial' not found in PostScript font database
Warning in grid.Call(C_textBounds, as.graphicsAnnot(x$label), x$x, x$y, : font
family 'Arial' not found in PostScript font database
Warning in grid.Call(C_textBounds, as.graphicsAnnot(x$label), x$x, x$y, : font
family 'Arial' not found in PostScript font databasedev.off()pdf
2 system(paste0("convert -geometry ",magick_geometry," ", here::here("..","synovialscrnaseq","output","Figures_Paper",paste0(figname,".tiff")), " ",here::here("..","synovialscrnaseq","output","Figures_Paper",paste0(figname,".tiff"))))
jpeg(here::here("..","synovialscrnaseq","output","Figures_Paper",paste0(figname,".jpeg")),width=width,height=height,res = initres, units = "in")
draw(hm_ls[["mp"]], ht_gap = unit(0, "mm"), merge_legends=TRUE, annotation_legend_list = lgd_list,align_annotation_legend="heatmap_center",align_heatmap_legend="heatmap_center",column_title=paste0("Figure S",stringr::str_extract(figname,"[[:digit:]]+$")),
column_title_gp=grid::gpar(fontsize=10*downscale,fontfamily="Arial"))Warning in grid.Call(C_textBounds, as.graphicsAnnot(x$label), x$x, x$y, : font
family 'Arial' not found in PostScript font database
Warning in grid.Call(C_textBounds, as.graphicsAnnot(x$label), x$x, x$y, : font
family 'Arial' not found in PostScript font database
Warning in grid.Call(C_textBounds, as.graphicsAnnot(x$label), x$x, x$y, : font
family 'Arial' not found in PostScript font database
Warning in grid.Call(C_textBounds, as.graphicsAnnot(x$label), x$x, x$y, : font
family 'Arial' not found in PostScript font database
Warning in grid.Call(C_textBounds, as.graphicsAnnot(x$label), x$x, x$y, : font
family 'Arial' not found in PostScript font database
Warning in grid.Call(C_textBounds, as.graphicsAnnot(x$label), x$x, x$y, : font
family 'Arial' not found in PostScript font databasedev.off()pdf
2 system(paste0("convert -geometry ",magick_geometry," ", here::here("..","synovialscrnaseq","output","Figures_Paper",paste0(figname,".jpeg")), " ",here::here("..","synovialscrnaseq","output","Figures_Paper",paste0(figname,".jpeg"))))
pdf(here::here("..","synovialscrnaseq","output","Figures_Paper",paste0(figname,".pdf")),width=width,height=height)
draw(hm_ls[["mp"]], ht_gap = unit(0, "mm"), merge_legends=TRUE, annotation_legend_list = lgd_list,align_annotation_legend="heatmap_center",align_heatmap_legend="heatmap_center",column_title=paste0("Figure S",stringr::str_extract(figname,"[[:digit:]]+$")),
column_title_gp=grid::gpar(fontsize=10*downscale))
dev.off()pdf
2 Supplementary Figure 17
hm <- hm_ls[["ec"]]

figname <- "Suppl_Figure_17"
width <- 26
height <- 18
res = 300
maxwidth <- 8.5
maxheight <- 11
downscale <- max(c(3,height/maxheight, width/maxwidth))
# ideally multiply by 'downscale' but imagemagick throws error for too large images
initres <- res*1.2
magick_geometry <- paste0(width/downscale*res,"x",height/downscale*res)


tiff(here::here("..","synovialscrnaseq","output","Figures_Paper",paste0(figname,".tiff")),width=width,height=height,res = initres, units = "in", compression="zip")
draw(hm,
   column_title=paste0("Figure S",stringr::str_extract(figname,"[[:digit:]]+$")),
   column_title_gp=grid::gpar(fontsize=10*downscale,fontfamily="Arial"))
Warning in grid.Call(C_textBounds, as.graphicsAnnot(x$label), x$x, x$y, : font
family 'Arial' not found in PostScript font database
Warning in grid.Call(C_textBounds, as.graphicsAnnot(x$label), x$x, x$y, : font
family 'Arial' not found in PostScript font database
Warning in grid.Call(C_textBounds, as.graphicsAnnot(x$label), x$x, x$y, : font
family 'Arial' not found in PostScript font database
Warning in grid.Call(C_textBounds, as.graphicsAnnot(x$label), x$x, x$y, : font
family 'Arial' not found in PostScript font database
Warning in grid.Call(C_textBounds, as.graphicsAnnot(x$label), x$x, x$y, : font
family 'Arial' not found in PostScript font database
Warning in grid.Call(C_textBounds, as.graphicsAnnot(x$label), x$x, x$y, : font
family 'Arial' not found in PostScript font databasedev.off()pdf
2 system(paste0("convert -geometry ",magick_geometry," ", here::here("..","synovialscrnaseq","output","Figures_Paper",paste0(figname,".tiff")), " ",here::here("..","synovialscrnaseq","output","Figures_Paper",paste0(figname,".tiff"))))
jpeg(here::here("..","synovialscrnaseq","output","Figures_Paper",paste0(figname,".jpeg")),width=width,height=height,res = initres, units = "in")
draw(hm,
column_title=paste0("Figure S",stringr::str_extract(figname,"[[:digit:]]+$")),
column_title_gp=grid::gpar(fontsize=10*downscale,fontfamily="Arial"))Warning in grid.Call(C_textBounds, as.graphicsAnnot(x$label), x$x, x$y, : font
family 'Arial' not found in PostScript font database
Warning in grid.Call(C_textBounds, as.graphicsAnnot(x$label), x$x, x$y, : font
family 'Arial' not found in PostScript font database
Warning in grid.Call(C_textBounds, as.graphicsAnnot(x$label), x$x, x$y, : font
family 'Arial' not found in PostScript font database
Warning in grid.Call(C_textBounds, as.graphicsAnnot(x$label), x$x, x$y, : font
family 'Arial' not found in PostScript font database
Warning in grid.Call(C_textBounds, as.graphicsAnnot(x$label), x$x, x$y, : font
family 'Arial' not found in PostScript font database
Warning in grid.Call(C_textBounds, as.graphicsAnnot(x$label), x$x, x$y, : font
family 'Arial' not found in PostScript font databasedev.off()pdf
2 system(paste0("convert -geometry ",magick_geometry," ", here::here("..","synovialscrnaseq","output","Figures_Paper",paste0(figname,".jpeg")), " ",here::here("..","synovialscrnaseq","output","Figures_Paper",paste0(figname,".jpeg"))))
pdf(here::here("..","synovialscrnaseq","output","Figures_Paper",paste0(figname,".pdf")),width=width,height=height)
draw(hm,
column_title=paste0("Figure S",stringr::str_extract(figname,"[[:digit:]]+$")),
column_title_gp=grid::gpar(fontsize=10*downscale))
dev.off()pdf
2
sessionInfo()R version 4.0.3 (2020-10-10)
Platform: x86_64-pc-linux-gnu (64-bit)
Running under: Ubuntu 20.04 LTS
Matrix products: default
BLAS/LAPACK: /usr/lib/x86_64-linux-gnu/openblas-pthread/libopenblasp-r0.3.8.so
locale:
[1] LC_CTYPE=en_US.UTF-8 LC_NUMERIC=C
[3] LC_TIME=en_US.UTF-8 LC_COLLATE=en_US.UTF-8
[5] LC_MONETARY=en_US.UTF-8 LC_MESSAGES=C
[7] LC_PAPER=en_US.UTF-8 LC_NAME=C
[9] LC_ADDRESS=C LC_TELEPHONE=C
[11] LC_MEASUREMENT=en_US.UTF-8 LC_IDENTIFICATION=C
attached base packages:
[1] grid parallel stats4 stats graphics grDevices utils
[8] datasets methods base
other attached packages:
[1] gdtools_0.2.3 ComplexHeatmap_2.6.2
[3] tidySingleCellExperiment_1.0.0 scuttle_1.0.4
[5] scran_1.18.7 scater_1.18.6
[7] ggplot2_3.3.3 SingleCellExperiment_1.12.0
[9] SummarizedExperiment_1.20.0 Biobase_2.50.0
[11] GenomicRanges_1.42.0 GenomeInfoDb_1.26.7
[13] IRanges_2.24.1 S4Vectors_0.28.1
[15] BiocGenerics_0.36.1 MatrixGenerics_1.2.1
[17] matrixStats_0.58.0 magrittr_2.0.1
[19] workflowr_1.6.2
loaded via a namespace (and not attached):
[1] readxl_1.3.1 backports_1.2.1
[3] circlize_0.4.12 systemfonts_1.0.1
[5] igraph_1.2.6 lazyeval_0.2.2
[7] BiocParallel_1.24.1 digest_0.6.27
[9] htmltools_0.5.1.1 viridis_0.5.1
[11] magick_2.6.0 fansi_0.4.2
[13] cluster_2.1.1 openxlsx_4.2.3
[15] limma_3.46.0 svglite_1.2.3.2
[17] colorspace_2.0-0 haven_2.3.1
[19] xfun_0.21 dplyr_1.0.4
[21] crayon_1.4.1 RCurl_1.98-1.2
[23] jsonlite_1.7.2 glue_1.4.2
[25] gtable_0.3.0 zlibbioc_1.36.0
[27] XVector_0.30.0 GetoptLong_1.0.5
[29] DelayedArray_0.16.3 car_3.0-10
[31] BiocSingular_1.6.0 shape_1.4.5
[33] abind_1.4-5 scales_1.1.1
[35] DBI_1.1.1 edgeR_3.32.1
[37] rstatix_0.7.0 Rcpp_1.0.6
[39] viridisLite_0.3.0 clue_0.3-58
[41] dqrng_0.2.1 foreign_0.8-81
[43] rsvd_1.0.3 htmlwidgets_1.5.3
[45] httr_1.4.2 RColorBrewer_1.1-2
[47] ellipsis_0.3.1 pkgconfig_2.0.3
[49] farver_2.0.3 locfit_1.5-9.4
[51] here_1.0.1 labeling_0.4.2
[53] tidyselect_1.1.0 rlang_0.4.10
[55] later_1.1.0.1 cellranger_1.1.0
[57] munsell_0.5.0 tools_4.0.3
[59] cli_2.3.0 generics_0.1.0
[61] broom_0.7.4 evaluate_0.14
[63] stringr_1.4.0 yaml_2.2.1
[65] RhpcBLASctl_0.20-137 knitr_1.31
[67] fs_1.5.0 zip_2.1.1
[69] purrr_0.3.4 sparseMatrixStats_1.2.1
[71] whisker_0.4 compiler_4.0.3
[73] beeswarm_0.2.3 plotly_4.9.3
[75] curl_4.3 png_0.1-7
[77] ggsignif_0.6.0 tibble_3.0.6
[79] statmod_1.4.35 stringi_1.5.3
[81] highr_0.8 forcats_0.5.1
[83] lattice_0.20-41 bluster_1.0.0
[85] Matrix_1.3-2 vctrs_0.3.6
[87] pillar_1.4.7 lifecycle_1.0.0
[89] GlobalOptions_0.1.2 BiocNeighbors_1.8.2
[91] data.table_1.13.6 cowplot_1.1.1
[93] bitops_1.0-6 irlba_2.3.3
[95] httpuv_1.5.5 R6_2.5.0
[97] promises_1.2.0.1 gridExtra_2.3
[99] rio_0.5.16 vipor_0.4.5
[101] assertthat_0.2.1 rprojroot_2.0.2
[103] rjson_0.2.20 withr_2.4.1
[105] GenomeInfoDbData_1.2.4 hms_1.0.0
[107] beachmat_2.6.4 tidyr_1.1.2
[109] rmarkdown_2.6 DelayedMatrixStats_1.12.3
[111] carData_3.0-4 Cairo_1.5-12.2
[113] git2r_0.28.0 ggpubr_0.4.0
[115] ggbeeswarm_0.6.0