EC_trajectory_analysis
retogerber
2024-01-22
Last updated: 2024-01-22
Checks: 6 1
Knit directory: synovialscrnaseq/
This reproducible R Markdown analysis was created with workflowr (version 1.6.2). The Checks tab describes the reproducibility checks that were applied when the results were created. The Past versions tab lists the development history.
The R Markdown is untracked by Git. To know which version of the R Markdown file created these results, you’ll want to first commit it to the Git repo. If you’re still working on the analysis, you can ignore this warning. When you’re finished, you can run wflow_publish to commit the R Markdown file and build the HTML.
Great job! The global environment was empty. Objects defined in the global environment can affect the analysis in your R Markdown file in unknown ways. For reproduciblity it’s best to always run the code in an empty environment.
The command set.seed(20210105) was run prior to running the code in the R Markdown file. Setting a seed ensures that any results that rely on randomness, e.g. subsampling or permutations, are reproducible.
Great job! Recording the operating system, R version, and package versions is critical for reproducibility.
Nice! There were no cached chunks for this analysis, so you can be confident that you successfully produced the results during this run.
Great job! Using relative paths to the files within your workflowr project makes it easier to run your code on other machines.
Great! You are using Git for version control. Tracking code development and connecting the code version to the results is critical for reproducibility.
The results in this page were generated with repository version 58eeb06. See the Past versions tab to see a history of the changes made to the R Markdown and HTML files.
Note that you need to be careful to ensure that all relevant files for the analysis have been committed to Git prior to generating the results (you can use wflow_publish or wflow_git_commit). workflowr only checks the R Markdown file, but you know if there are other scripts or data files that it depends on. Below is the status of the Git repository when the results were generated:
Ignored files:
    Ignored:    '/
    Ignored:    .Rhistory
    Ignored:    .Rproj.user/
    Ignored:    .empty/
    Ignored:    analysis/.Rhistory
    Ignored:    analysis/iSEE_interactive_document.html
    Ignored:    code/test_files/
    Ignored:    data/Culemann/
    Ignored:    data/E-MTAB-8322/
    Ignored:    data/Synovial scRNA-seq samples - Sheet1.csv
    Ignored:    data/Zhang_top20_singlecell_cluster_markers_fromGithub.csv
    Ignored:    data/findMarkers_results.rds
    Ignored:    data/findMarkers_results_v2.rds
    Ignored:    data/info/
    Ignored:    data/syn_sce_tidy_filtered.rds
    Ignored:    data/syn_sce_tidy_hvg.rds
    Ignored:    data/syn_sce_tidy_hvg_cms.rds
    Ignored:    docs/
    Ignored:    output/Figures_Paper/
    Ignored:    output/Sample_summaries_RA_comparisons.rds
    Ignored:    output/Sample_summaries_direct_dissociation.rds
    Ignored:    output/Sample_summaries_exvivo_treatment.rds
    Ignored:    output/Suppl_Figure_4d.rds
    Ignored:    output/barcodes.txt
    Ignored:    output/barcodes_filtered.txt
    Ignored:    output/column_metadata_filtered.txt
    Ignored:    output/combined_v7_SingleR_markers.rds
    Ignored:    output/combined_v7_SingleR_predictions.rds
    Ignored:    output/combined_v7_SingleR_predictions_lclc.rds
    Ignored:    output/combined_v7_SingleR_predictions_reclc.rds
    Ignored:    output/combined_v7_SingleR_predictions_recrec.rds
    Ignored:    output/combined_v7_SingleR_trained.rds
    Ignored:    output/combined_v7_sce.rds
    Ignored:    output/combined_v7_sce_filtered.rds
    Ignored:    output/combined_v7_sce_hvg.rds
    Ignored:    output/combined_v7_sce_hvg_cms.rds
    Ignored:    output/combined_v7_sce_hvg_cms_annotated.rds
    Ignored:    output/combined_v7_sce_tmp_hvg_cms.rds
    Ignored:    output/combined_v7_upsetplot_genelists.rds
    Ignored:    output/count_matrix_filtered.mtx
    Ignored:    output/count_matrix_unfiltered.mtx
    Ignored:    output/emptyDrops_result_v4.rds
    Ignored:    output/emptyDrops_result_v4_tmp.rds
    Ignored:    output/emptyDrops_result_v4tmptmp.rds
    Ignored:    output/findMarkers_results_v6.rds
    Ignored:    output/findMarkers_results_v6_ec.rds
    Ignored:    output/findMarkers_results_v6_main.rds
    Ignored:    output/findMarkers_results_v6_mp.rds
    Ignored:    output/findMarkers_results_v6_sf.rds
    Ignored:    output/findMarkers_results_v6_tc.rds
    Ignored:    output/findMarkers_results_v7_ec.rds
    Ignored:    output/findMarkers_results_v7_main.rds
    Ignored:    output/findMarkers_results_v7_mp.rds
    Ignored:    output/findMarkers_results_v7_sf.rds
    Ignored:    output/findMarkers_results_v7_tc.rds
    Ignored:    output/genes.txt
    Ignored:    output/genes_filtered.txt
    Ignored:    output/goana_results_v6_ec.rds
    Ignored:    output/goana_results_v6_mp.rds
    Ignored:    output/preprocessing_number_of_cells.rds
    Ignored:    output/syn_v4_sce_emptyDrops_invivo.rds
    Ignored:    output/syn_v4_swappedDrops_24300_after.rds
    Ignored:    output/syn_v4_swappedDrops_24300_before.rds
    Ignored:    output/syn_v4_swappedDrops_24793_after.rds
    Ignored:    output/syn_v4_swappedDrops_24793_before.rds
    Ignored:    output/syn_v6_cluster_cellid_match_invivo.rds
    Ignored:    output/syn_v6_clustering_lookup_invivo.rds
    Ignored:    output/syn_v6_clustering_lookup_multiple_invivo.rds
    Ignored:    output/syn_v6_sce.rds
    Ignored:    output/syn_v6_sce_Figure8.rds
    Ignored:    output/syn_v6_sce_Figure8_dic_ls.rds
    Ignored:    output/syn_v6_sce_ec_invivo.rds
    Ignored:    output/syn_v6_sce_filtered_invivo.rds
    Ignored:    output/syn_v6_sce_hdf5/
    Ignored:    output/syn_v6_sce_hvg_cms_doublet_invivo.rds
    Ignored:    output/syn_v6_sce_hvg_cms_doublet_subcluster_invivo.rds
    Ignored:    output/syn_v6_sce_hvg_invivo.rds
    Ignored:    output/syn_v6_sce_hvg_marker_genes.rds
    Ignored:    output/syn_v6_sce_mp_invivo.rds
    Ignored:    output/syn_v6_sce_sf_invivo.rds
    Ignored:    output/syn_v6_sce_tc_invivo.rds
    Ignored:    output/syn_v6_sfig1.rds
    Ignored:    output/syn_v6_vst_out_invivo.rds
    Ignored:    output/syn_v7_cluster_cellid_match_invivo.rds
    Ignored:    output/syn_v7_clustering_lookup_invivo.rds
    Ignored:    output/syn_v7_clustering_lookup_multiple_invivo.rds
    Ignored:    output/syn_v7_sce.rds
    Ignored:    output/syn_v7_sce_Figure8.rds
    Ignored:    output/syn_v7_sce_Figure8_dic_ls.rds
    Ignored:    output/syn_v7_sce_ec_invivo.rds
    Ignored:    output/syn_v7_sce_ec_invivo_trajectory.rds
    Ignored:    output/syn_v7_sce_ec_invivo_trajectory2.rds
    Ignored:    output/syn_v7_sce_ec_invivo_trajectory2_ATres.rds
    Ignored:    output/syn_v7_sce_ec_invivo_trajectory_icMat.rds
    Ignored:    output/syn_v7_sce_filtered_invivo.rds
    Ignored:    output/syn_v7_sce_hdf5/
    Ignored:    output/syn_v7_sce_hvg_cms_doublet_invivo.rds
    Ignored:    output/syn_v7_sce_hvg_cms_doublet_subcluster_invivo.rds
    Ignored:    output/syn_v7_sce_hvg_cms_doublet_subcluster_invivo_cleaned.rds
    Ignored:    output/syn_v7_sce_hvg_invivo.rds
    Ignored:    output/syn_v7_sce_mp_invivo.rds
    Ignored:    output/syn_v7_sce_sf_invivo.rds
    Ignored:    output/syn_v7_sce_tc_invivo.rds
    Ignored:    output/syn_v7_sfig1.rds
    Ignored:    output/syn_v7_vst_out_invivo.rds

Untracked files:
    Untracked:  analysis/clean_and_save_sce.R
    Untracked:  analysis/description_integration_wei_stephenson
    Untracked:  analysis/scRNAseq_complete_01_preprocessing_comparison.Rmd
    Untracked:  analysis/scRNAseq_complete_05_ec_trajectory_analysis.Rmd
    Untracked:  analysis/scRNAseq_complete_05_ec_trajectory_analysis_2.Rmd
    Untracked:  analysis/scRNAseq_complete_05_ec_trajectory_analysis_3.Rmd
    Untracked:  code/rebuild_ezRun.R
    Untracked:  code/tmp1.R
    Untracked:  code/tmp1.Rmd
    Untracked:  nonhosted_public/
    Untracked:  singRstudio.sh.bak

Unstaged changes:
    Modified:   analysis/scRNAseq_combined_06_Figures.Rmd
    Modified:   analysis/scRNAseq_complete_04-2_celltype_markers.Rmd
    Modified:   analysis/scRNAseq_complete_04-2_celltype_markers_subcelltypes.Rmd
    Modified:   analysis/scRNAseq_complete_04_Annotation_v7.Rmd
    Modified:   analysis/scRNAseq_complete_Figures.Rmd
    Modified:   analysis/write_tsv.Rmd
    Modified:   code/create_hdf5.R
Note that any generated files, e.g. HTML, png, CSS, etc., are not included in this status report because it is ok for generated content to have uncommitted changes.
There are no past versions. Publish this analysis with wflow_publish() to start tracking its development.
Set up
suppressPackageStartupMessages({
  library(SingleCellExperiment)
  library(slingshot)
  library(tradeSeq)
  library(ggplot2)
})
n_workers <- 20
RhpcBLASctl::blas_set_num_threads(n_workers)

remove_low_quality_samples <- TRUE
analysis_version <- 7
source(here::here("code","utilities_plots.R"))

here::here()
[1] "/home/retger/Synovial/synovialscrnaseq"set.seed(100)tmpfilename <- paste0("syn_v",analysis_version,"_sce_ec",dplyr::if_else(remove_low_quality_samples, "_invivo",""),"_trajectory.rds")
sce_full <- readRDS(file = here::here("output",tmpfilename))
sce_full <- sce_full[!duplicated(row.names(sce_full)),]Loading required package: tidySingleCellExperiment
Attaching package: 'tidySingleCellExperiment'The following object is masked from 'package:IRanges':
sliceThe following object is masked from 'package:S4Vectors':
renameThe following object is masked from 'package:matrixStats':
countThe following object is masked from 'package:stats':
filterLoading required package: BiocSingularsce_full <- sce_full[rowData(sce_full)$is_hvg,]tmpfilename <- paste0("syn_v",analysis_version,"_sce_ec",dplyr::if_else(remove_low_quality_samples, "_invivo",""),"_trajectory2.rds")
sce <- readRDS(file = here::here("output",tmpfilename))table(rowData(sce)$tradeSeq$converged)
FALSE  TRUE
  379  3426
Association of gene expression with pseudotime
Sort by FDR and filter by meanLogFC>1
tmpfilename <- paste0("syn_v",analysis_version,"_sce_ec",dplyr::if_else(remove_low_quality_samples, "_invivo",""),"_trajectory2_ATres.rds")
ATres <- readRDS(file = here::here("output",tmpfilename))
ATres <- ATres[rowData(sce)$tradeSeq$converged,]
sce_full <- sce_full[rowData(sce)$tradeSeq$converged,]
sce <- sce[rowData(sce)$tradeSeq$converged,]
ATres$FDR <- p.adjust(ATres$pvalue)
aStart <- order(ATres$waldStat, decreasing = TRUE)
lcm <- rowMeans(logcounts(sce_full))
stopifnot(all(rownames(sce_full) == rownames(ATres)))
aStart_filt <- aStart[lcm[aStart]>1]
ATres_filt <- ATres[aStart_filt,]
ATres_filt <- ATres_filt[ATres_filt$FDR<0.01,]
ATres_filt <- ATres_filt[!stringr::str_detect(rownames(ATres_filt),"^NA(.){0,1}[0-9]{0,2}$"),]genenames <- rownames(ATres_filt)js <- seq(1,length(genenames),by=16)
js <- js[1:5]
for(j in seq_along(js)[-length(js)]){
pltls <- lapply((js[j]):(js[j+1]-1),function(i) plotSmoothers(sce, counts(sce), gene = genenames[i], pointCol=sce_full$ec_celltype_simplified) + ggplot2::ggtitle(genenames[i]))
print(ggpubr::ggarrange(plotlist=pltls, common.legend = TRUE, align="hv"))
}Suppl Figure 16
sce_full$ec_celltype_simplified[sce_full$ec_celltype_simplified=="ec venous"] <- "ACKR1+ venous"
tmpplt <-  plotSmoothers(sce, counts(sce), gene = "FLT1", pointCol=sce_full$ec_celltype_simplified, size=10) + labs(color="Endothelial cell labels")
leg <- ggpubr::get_legend(tmpplt)
tm <- ggpubr::as_ggplot(leg)

genenames <- c("PODXL")
pltls <- lapply(seq_along(genenames),function(i) plotSmoothers(sce, counts(sce), gene = genenames[i], pointCol=sce_full$ec_celltype_simplified) + ggplot2::ggtitle(genenames[i]))
plta <- ggpubr::ggarrange(plotlist=c(pltls,list(ggplot()+theme_void()),list(tm)), legend = "none", align="hv", nrow = 1,ncol=5)

genenames <- c("SPARC", "COL4A1", "COL4A2", "COL15A1", "PLVAP")
pltls <- lapply(seq_along(genenames),function(i) plotSmoothers(sce, counts(sce), gene = genenames[i], pointCol=sce_full$ec_celltype_simplified) + ggplot2::ggtitle(genenames[i]))
pltb <- ggpubr::ggarrange(plotlist=pltls, legend = "none", align="hv", nrow = 1,ncol=5)

genenames <- c("VWF", "ACKR1", "CLU")
pltls <- lapply(seq_along(genenames),function(i) plotSmoothers(sce, counts(sce), gene = genenames[i], pointCol=sce_full$ec_celltype_simplified) + ggplot2::ggtitle(genenames[i]))
pltc <- ggpubr::ggarrange(plotlist=pltls, legend = "none", align="hv", nrow = 1,ncol=5)


genenames <- c("SELE", "SELP", "ICAM1")
pltls <- lapply(seq_along(genenames),function(i) plotSmoothers(sce, counts(sce), gene = genenames[i], pointCol=sce_full$ec_celltype_simplified) + ggplot2::ggtitle(genenames[i]))
pltd <- ggpubr::ggarrange(plotlist=pltls, legend = "none", align="hv", nrow = 1,ncol=5)


genenames <- c("HLA-DRA", "HLA-DPA1", "CD74")
pltls <- lapply(seq_along(genenames),function(i) plotSmoothers(sce, counts(sce), gene = genenames[i], pointCol=sce_full$ec_celltype_simplified) + ggplot2::ggtitle(genenames[i]))
plte <- ggpubr::ggarrange(plotlist=pltls, legend = "none", align="hv", nrow = 1,ncol=5)

genenames <- c("JUN", "JUNB", "FOS", "FOSB")
pltls <- lapply(seq_along(genenames),function(i) plotSmoothers(sce, counts(sce), gene = genenames[i], pointCol=sce_full$ec_celltype_simplified) + ggplot2::ggtitle(genenames[i]))
pltf <- ggpubr::ggarrange(plotlist=pltls, legend = "none", align="hv", nrow = 1,ncol=5)


genenames <- c("FLT1","NFKBIA", "IRF1", "SOCS3")
pltls <- lapply(seq_along(genenames),function(i) plotSmoothers(sce, counts(sce), gene = genenames[i], pointCol=sce_full$ec_celltype_simplified) + ggplot2::ggtitle(genenames[i]))
pltg <- ggpubr::ggarrange(plotlist=pltls, legend = "none", align="hv", nrow = 1,ncol=5)
plt <- ggpubr::ggarrange(
plta + theme_bw() + main_plot_theme() + theme(panel.background = element_rect(fill = "white"), legend.key = element_rect(fill = "white"), panel.border = element_blank()),
pltb + theme_bw() + main_plot_theme() + theme(panel.background = element_rect(fill = "white"), legend.key = element_rect(fill = "white"), panel.border = element_blank()),
pltc + theme_bw() + main_plot_theme() + theme(panel.background = element_rect(fill = "white"), legend.key = element_rect(fill = "white"), panel.border = element_blank()),
pltd + theme_bw() + main_plot_theme() + theme(panel.background = element_rect(fill = "white"), legend.key = element_rect(fill = "white"), panel.border = element_blank()),
plte + theme_bw() + main_plot_theme() + theme(panel.background = element_rect(fill = "white"), legend.key = element_rect(fill = "white"), panel.border = element_blank()),
pltf + theme_bw() + main_plot_theme() + theme(panel.background = element_rect(fill = "white"), legend.key = element_rect(fill = "white"), panel.border = element_blank()),
pltg + theme_bw() + main_plot_theme() + theme(panel.background = element_rect(fill = "white"), legend.key = element_rect(fill = "white"), panel.border = element_blank()),
common.legend=TRUE,
align="hv",
ncol=1,
font.label=list(size=26),
labels="auto"
)
plt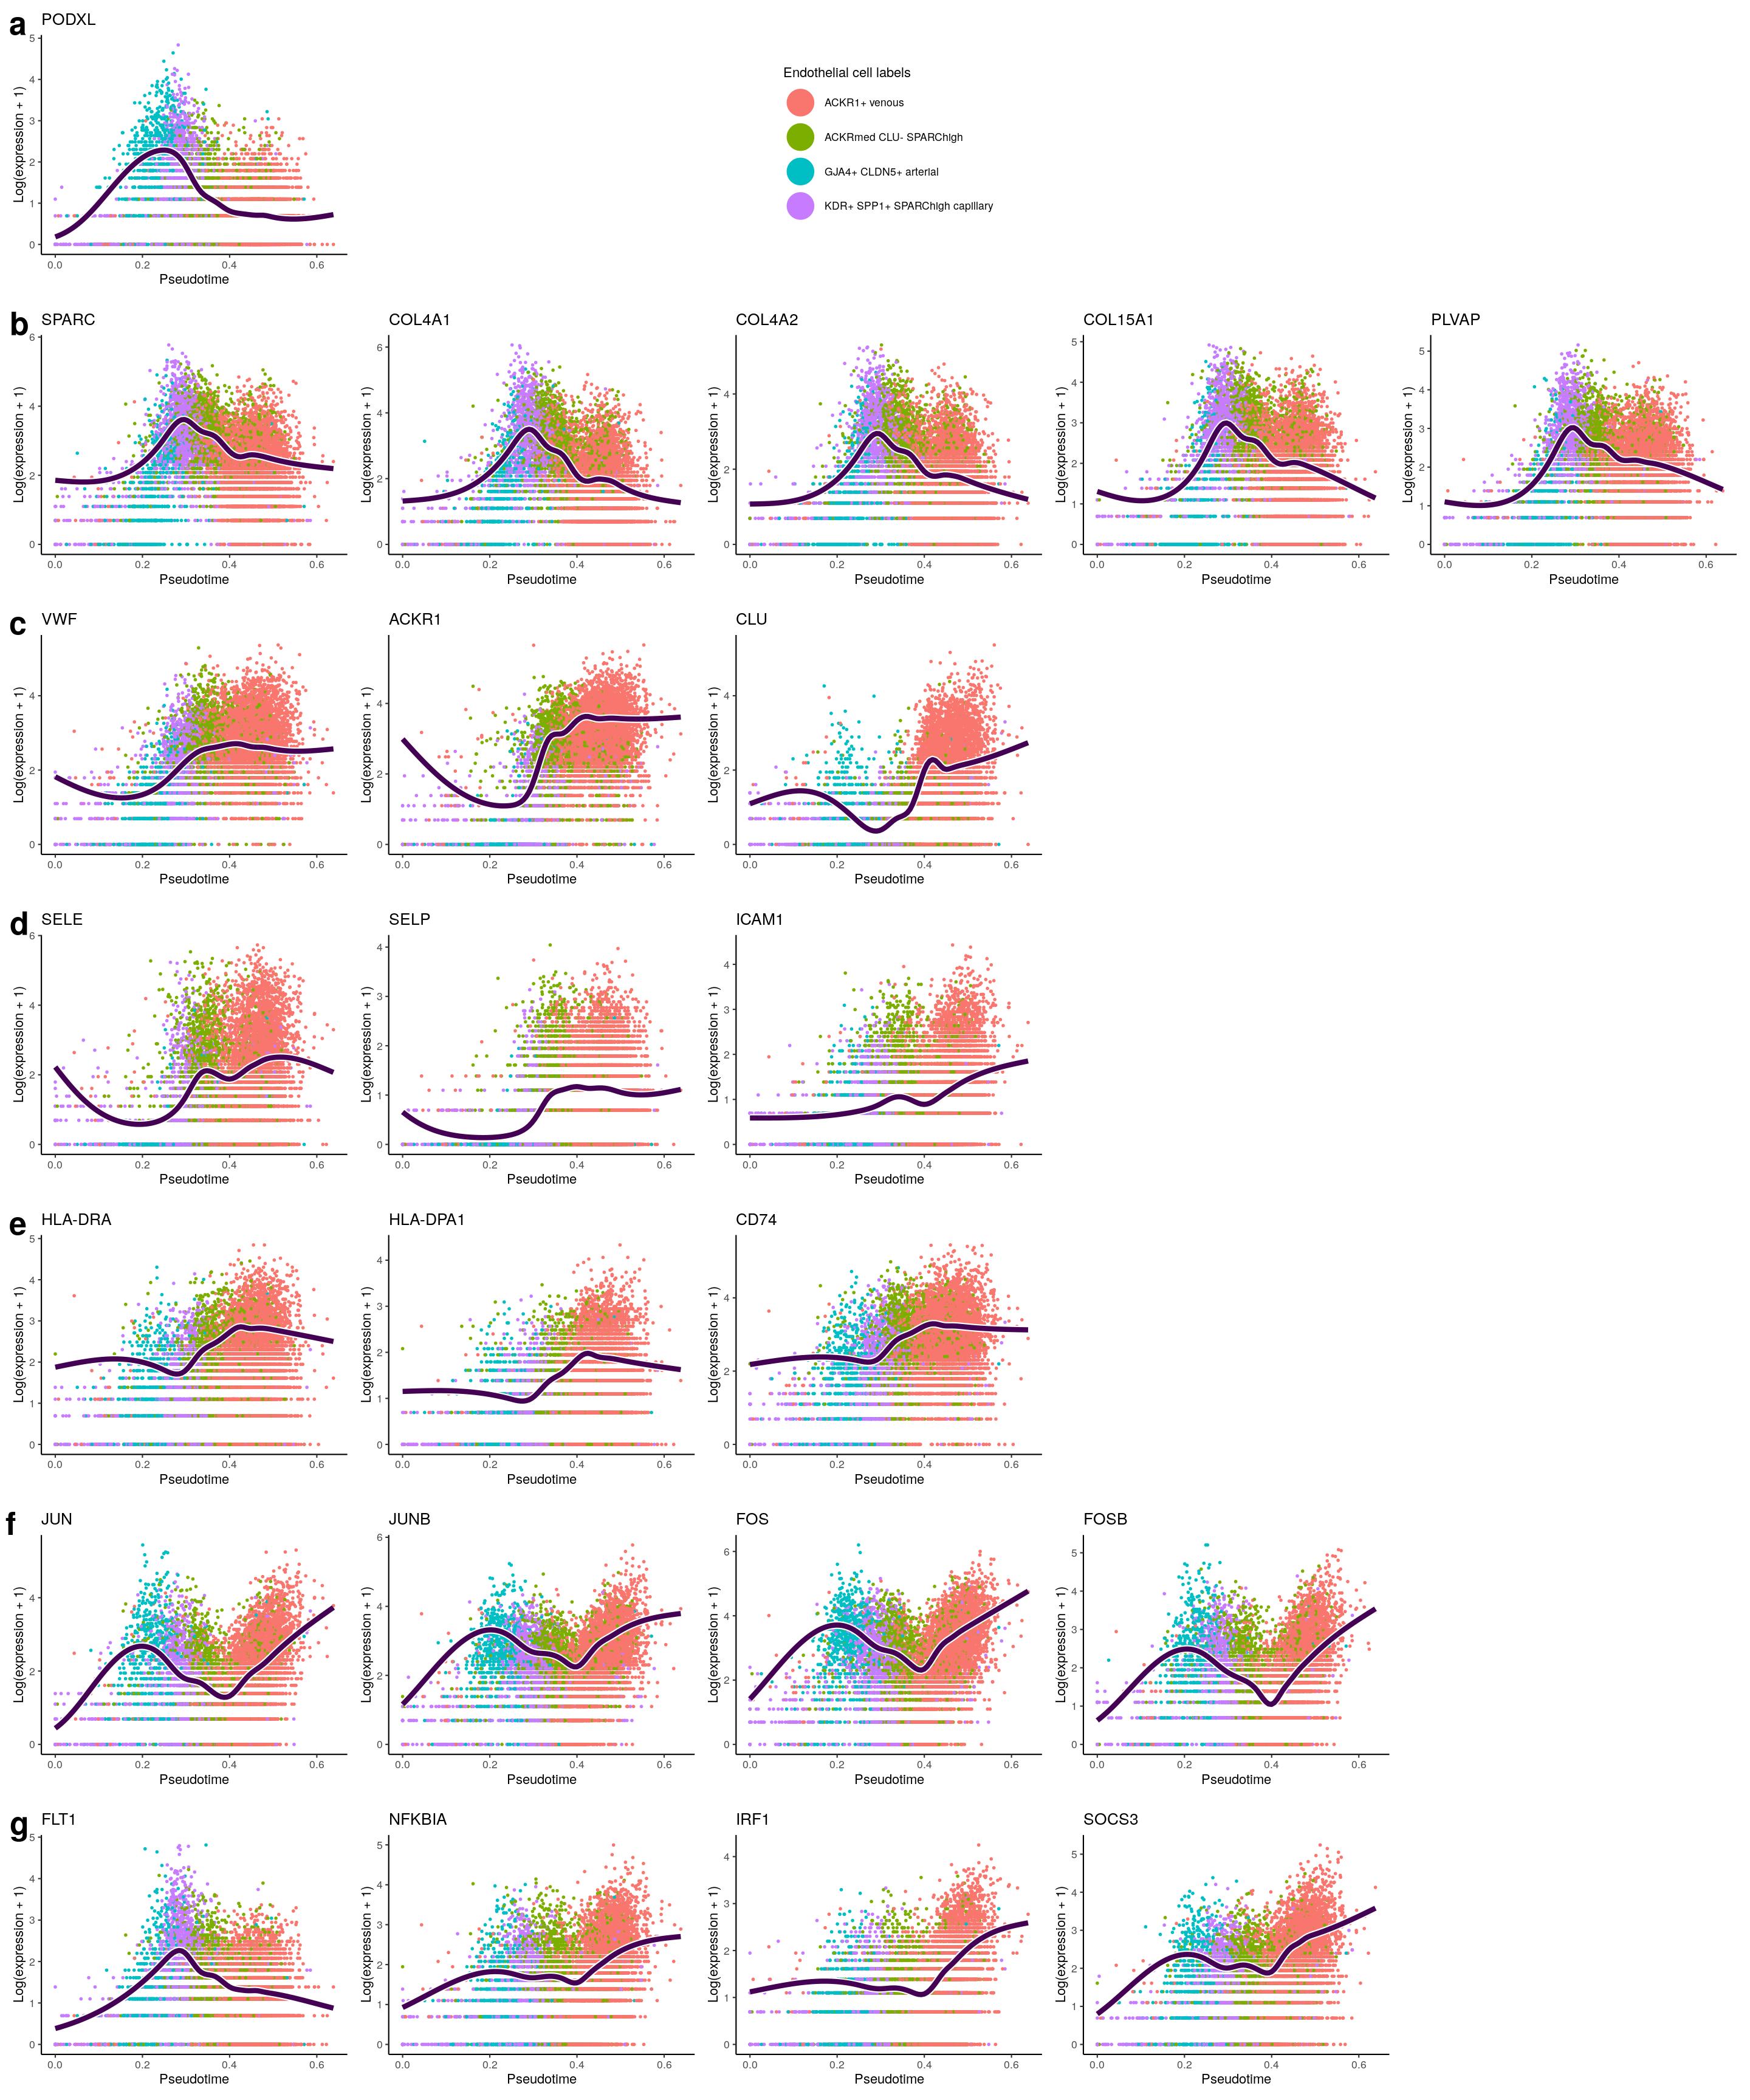
figname <- "Suppl_Figure_16"
width <- 20
height <- 24
res = 300
maxwidth <- 8.5
maxheight <- 11
downscale <- max(c(3,height/maxheight, width/maxwidth))
# ideally multiply by 'downscale' but imagemagick throws error for too large images
initres <- res*1.2
magick_geometry <- paste0(width/downscale*res,"x",height/downscale*res)

plt <- plt +
  labs(title=paste0("Figure S",stringr::str_extract(figname,"[[:digit:]]+$"))) +
  theme(plot.title = element_text(size=10*downscale))

tiff(here::here("..","synovialscrnaseq","output","Figures_Paper",paste0(figname,".tiff")),width=width,height=height,res = initres, units = "in", compression="zip")
plt + theme(plot.title = element_text(size=10*downscale, family="Arial"))
dev.off()
pdf
2 system(paste0("convert -geometry ",magick_geometry," ", here::here("..","synovialscrnaseq","output","Figures_Paper",paste0(figname,".tiff")), " ",here::here("..","synovialscrnaseq","output","Figures_Paper",paste0(figname,".tiff"))))
jpeg(here::here("..","synovialscrnaseq","output","Figures_Paper",paste0(figname,".jpeg")),width=width,height=height,res = initres, units = "in")
plt + theme(plot.title = element_text(size=10*downscale, family="Arial"))
dev.off()pdf
2 system(paste0("convert -geometry ",magick_geometry," ", here::here("..","synovialscrnaseq","output","Figures_Paper",paste0(figname,".jpeg")), " ",here::here("..","synovialscrnaseq","output","Figures_Paper",paste0(figname,".jpeg"))))
pdf(here::here("..","synovialscrnaseq","output","Figures_Paper",paste0(figname,".pdf")),width=width,height=height)
plt
dev.off()pdf
2 startRes <- startVsEndTest(sce)oStart <- order(startRes$waldStat, decreasing = TRUE)
startRes[oStart,]
lcm <- rowMeans(logcounts(sce_full))
stopifnot(all(rownames(sce_full) == rownames(startRes)))
oStart_filt <- oStart[lcm[oStart]>1]
genenames <- rownames(startRes[oStart_filt,])js <- seq(1,length(oStart_filt),by=16)
for(j in js){
pltls <- lapply((j):(j+15),function(i) plotSmoothers(sce, counts(sce), gene = names(sce)[oStart_filt[i]], pointCol=sce_full$ec_celltype_simplified) + ggplot2::ggtitle(names(sce)[oStart_filt[i]]))
print(ggpubr::ggarrange(plotlist=pltls, common.legend = TRUE, align="hv"))
}pltls <- lapply(1:16,function(i) plotSmoothers(sce, counts(sce), gene = names(sce)[oStart_filt[i]]) + ggplot2::ggtitle(names(sce)[oStart_filt[i]]))
ggpubr::ggarrange(plotlist=pltls, common.legend = TRUE, align="hv")library(clusterExperiment)
nPointsClus <- 20
clusPat <- clusterExpressionPatterns(sce, nPoints = nPointsClus,
genes = names(sce)[oStart_filt], ncores=n_workers,
minSizes=12)clusterLabels <- primaryCluster(clusPat$rsec)tg <- names(sce)[oStart_filt][clusterLabels==1]
pltls <- lapply(1:16,function(i) plotSmoothers(sce, counts(sce), gene = tg[i]) + ggplot2::ggtitle(tg[i]))
ggpubr::ggarrange(plotlist=pltls, common.legend = TRUE, align="hv")
sessionInfo()R version 4.0.3 (2020-10-10)
Platform: x86_64-pc-linux-gnu (64-bit)
Running under: Ubuntu 20.04 LTS
Matrix products: default
BLAS/LAPACK: /usr/lib/x86_64-linux-gnu/openblas-pthread/libopenblasp-r0.3.8.so
locale:
[1] LC_CTYPE=en_US.UTF-8 LC_NUMERIC=C
[3] LC_TIME=en_US.UTF-8 LC_COLLATE=en_US.UTF-8
[5] LC_MONETARY=en_US.UTF-8 LC_MESSAGES=C
[7] LC_PAPER=en_US.UTF-8 LC_NAME=C
[9] LC_ADDRESS=C LC_TELEPHONE=C
[11] LC_MEASUREMENT=en_US.UTF-8 LC_IDENTIFICATION=C
attached base packages:
[1] parallel stats4 stats graphics grDevices utils datasets
[8] methods base
other attached packages:
[1] gdtools_0.2.3 BiocSingular_1.6.0
[3] tidySingleCellExperiment_1.0.0 ggplot2_3.3.3
[5] tradeSeq_1.4.0 slingshot_1.8.0
[7] princurve_2.1.6 SingleCellExperiment_1.12.0
[9] SummarizedExperiment_1.20.0 Biobase_2.50.0
[11] GenomicRanges_1.42.0 GenomeInfoDb_1.26.7
[13] IRanges_2.24.1 S4Vectors_0.28.1
[15] BiocGenerics_0.36.1 MatrixGenerics_1.2.1
[17] matrixStats_0.58.0 workflowr_1.6.2
loaded via a namespace (and not attached):
[1] readxl_1.3.1 backports_1.2.1 VGAM_1.1-5
[4] systemfonts_1.0.1 plyr_1.8.6 igraph_1.2.6
[7] lazyeval_0.2.2 splines_4.0.3 BiocParallel_1.24.1
[10] densityClust_0.3 fastICA_1.2-2 digest_0.6.27
[13] htmltools_0.5.1.1 viridis_0.5.1 fansi_0.4.2
[16] magrittr_2.0.1 cluster_2.1.1 openxlsx_4.2.3
[19] limma_3.46.0 docopt_0.7.1 svglite_1.2.3.2
[22] colorspace_2.0-0 ggrepel_0.9.1 haven_2.3.1
[25] xfun_0.21 dplyr_1.0.4 sparsesvd_0.2
[28] crayon_1.4.1 RCurl_1.98-1.2 jsonlite_1.7.2
[31] ape_5.4-1 glue_1.4.2 gtable_0.3.0
[34] zlibbioc_1.36.0 XVector_0.30.0 DelayedArray_0.16.3
[37] car_3.0-10 abind_1.4-5 scales_1.1.1
[40] pheatmap_1.0.12 DBI_1.1.1 edgeR_3.32.1
[43] rstatix_0.7.0 Rcpp_1.0.6 viridisLite_0.3.0
[46] foreign_0.8-81 rsvd_1.0.3 htmlwidgets_1.5.3
[49] httr_1.4.2 FNN_1.1.3 RColorBrewer_1.1-2
[52] ellipsis_0.3.1 pkgconfig_2.0.3 farver_2.0.3
[55] locfit_1.5-9.4 here_1.0.1 tidyselect_1.1.0
[58] labeling_0.4.2 rlang_0.4.10 reshape2_1.4.4
[61] later_1.1.0.1 munsell_0.5.0 cellranger_1.1.0
[64] tools_4.0.3 cli_2.3.0 generics_0.1.0
[67] broom_0.7.4 evaluate_0.14 stringr_1.4.0
[70] yaml_2.2.1 RhpcBLASctl_0.20-137 knitr_1.31
[73] fs_1.5.0 zip_2.1.1 DDRTree_0.1.5
[76] purrr_0.3.4 RANN_2.6.1 pbapply_1.4-3
[79] nlme_3.1-152 monocle_2.18.0 slam_0.1-48
[82] compiler_4.0.3 plotly_4.9.3 curl_4.3
[85] ggsignif_0.6.0 tibble_3.0.6 stringi_1.5.3
[88] highr_0.8 forcats_0.5.1 lattice_0.20-41
[91] Matrix_1.3-2 HSMMSingleCell_1.10.0 vctrs_0.3.6
[94] pillar_1.4.7 lifecycle_1.0.0 combinat_0.0-8
[97] cowplot_1.1.1 data.table_1.13.6 bitops_1.0-6
[100] irlba_2.3.3 httpuv_1.5.5 R6_2.5.0
[103] promises_1.2.0.1 gridExtra_2.3 rio_0.5.16
[106] assertthat_0.2.1 rprojroot_2.0.2 withr_2.4.1
[109] qlcMatrix_0.9.7 GenomeInfoDbData_1.2.4 mgcv_1.8-34
[112] hms_1.0.0 grid_4.0.3 beachmat_2.6.4
[115] tidyr_1.1.2 rmarkdown_2.6 carData_3.0-4
[118] Rtsne_0.15 git2r_0.28.0 ggpubr_0.4.0